HOT TOPICS LIST
- MACD
- Fibonacci
- RSI
- Gann
- ADXR
- Stochastics
- Volume
- Triangles
- Futures
- Cycles
- Volatility
- ZIGZAG
- MESA
- Retracement
- Aroon
INDICATORS LIST
LIST OF TOPICS
PRINT THIS ARTICLE
by Donald W. Pendergast, Jr.
Volatility in the S&P 500 index is heating up as a major, broad market correction in US stocks is setting up.
Position: N/A
Donald W. Pendergast, Jr.
Freelance financial markets writer and online publisher of the Trendzetterz.com S&P 500 Weekly Forecast service.
PRINT THIS ARTICLE
VXX: Pausing Before Another Spike?
12/05/13 03:26:48 PMby Donald W. Pendergast, Jr.
Volatility in the S&P 500 index is heating up as a major, broad market correction in US stocks is setting up.
Position: N/A
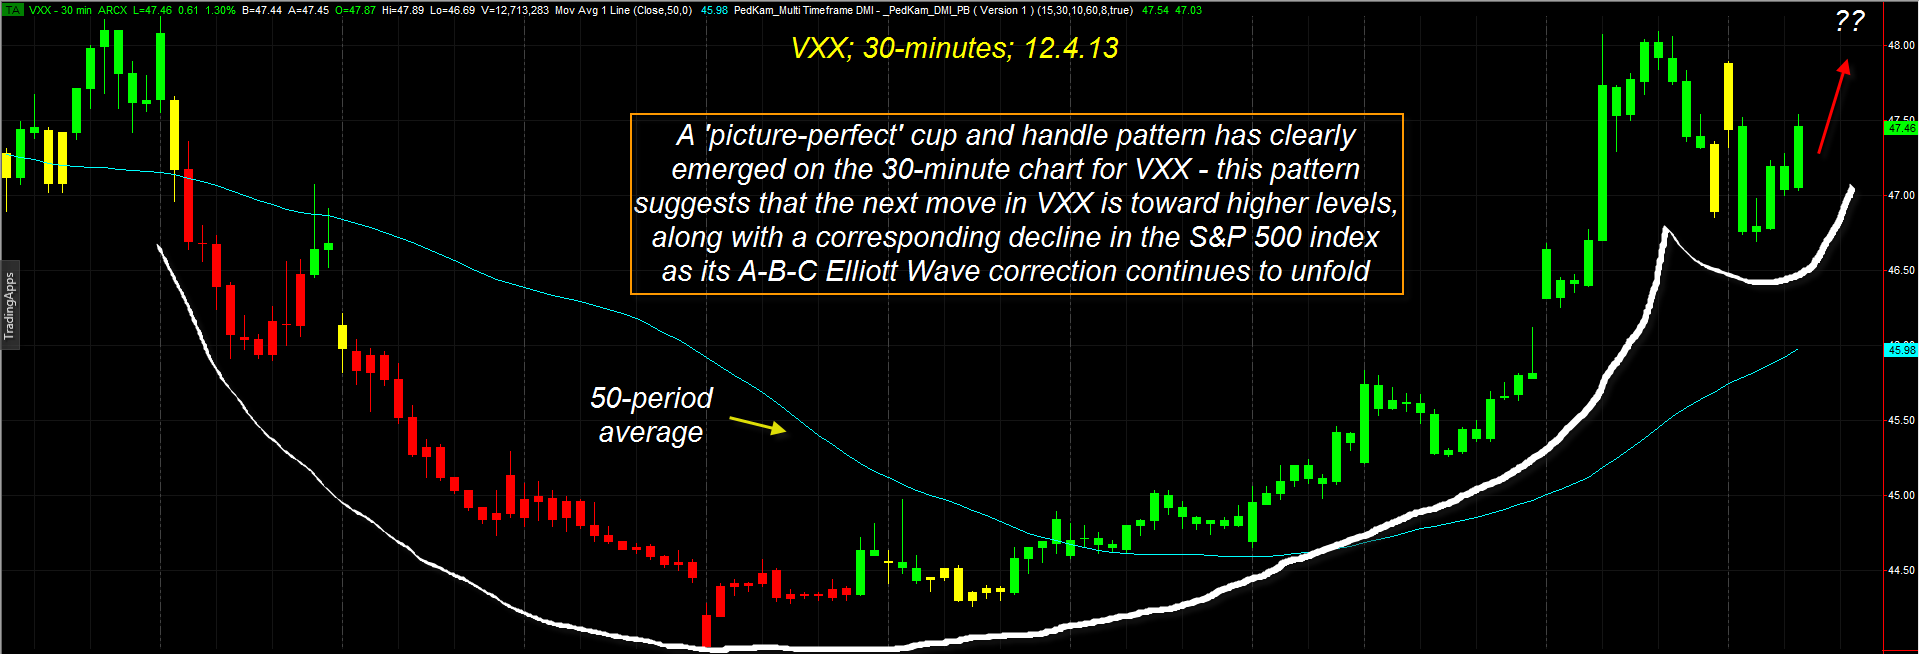
| Volatility in the S&P 500 index had declined steadily during its recent eight-week rally and now appears to be set to spike higher as the fifth waves in all major US stock indexes finally terminate prior to a large Elliott Wave A-B-C correction. Here's a closer look (Figure 1). |

|
| Figure 1. A very well-formed cup and handle pattern has appeared on the 30-minute chart of the VXX. This has a high probability of resolving itself with more bullish price action. |
| Graphic provided by: TradeStation. |
| |
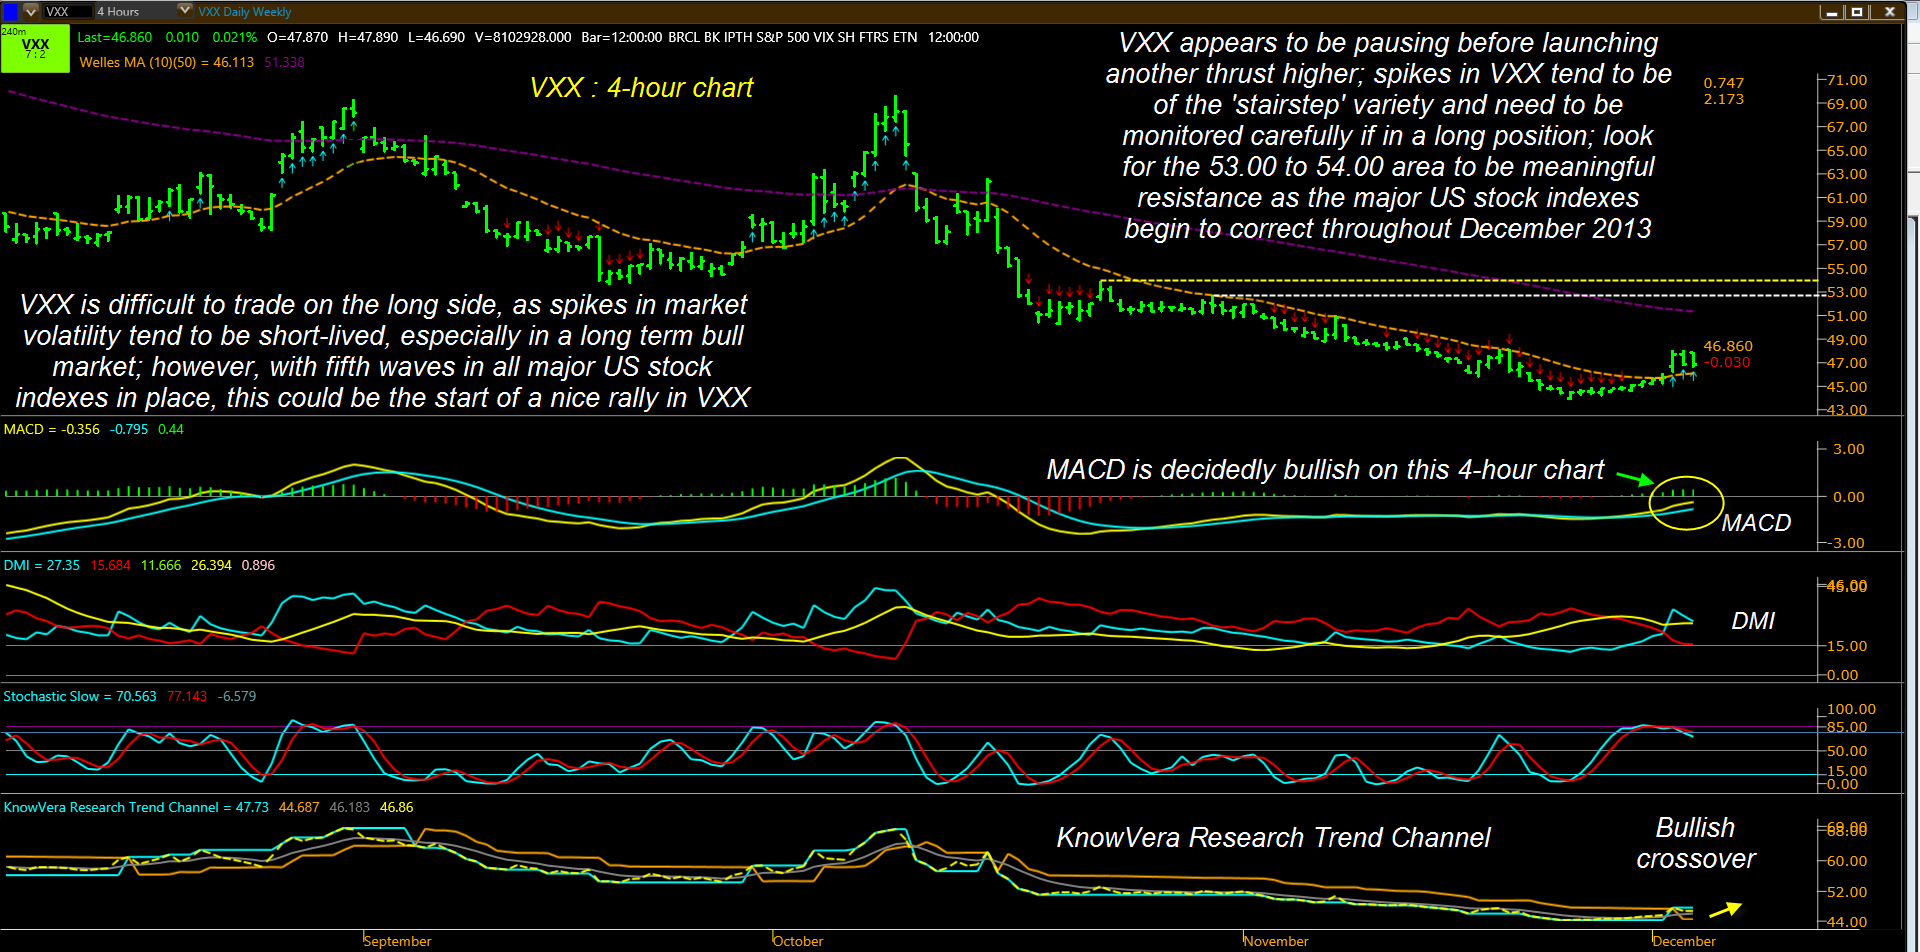
| The iPath S&P 500 VIX Short-Term ETF (VXX) is one of the most fascinating of all exchange-traded funds, and is a great tool to assist market timers of the S&P 500 and Dow 30 indexes (SPY,.SPX, DIA, .DJIA). The VXX moves inversely to the direction of the .SPX and tends to trend smoothly (downward) when the .SPX goes into a sustained bullish trend; conversely, the VXX will make sudden reversals as it spikes higher during pullbacks and corrections in the .SPX. During sustained bull markets, these spikes in VXX are relatively short-lived affairs that don't have much staying power — as witnessed by the last two rallies in the VXX in August 2013 and October 2013. However, during the kind of major bear market reversal seen in 2000-2002 and 2007-2009, the VXX really cranked higher for a sustained time as panic fueled investor buying frenzy for .SPX put options during those periods of market free-fall. While it is still unclear how the nascent trend reversal in the Dow 30 and .SPX will play out this time, it remains that all major US stock indexes are overextended and that there are clear 5-wave Elliott Wave patterns in each of them — most of which are at or close to completing. Therefore, the incredible "cup & handle" pattern seen on the VXX 30-minute chart should be taken as further confirmation that a major market top has formed or is in process of forming; this famed, highly predictive market pattern was made famous by William J. O'Neill back in the 1960s and still appears to be as powerful today as it was back then. Notice the smooth outline of the cup and then the more ragged handle — no two patterns are exactly alike, but this one is suggesting that buyers are stepping in again to drive VXX up past its November 20, 2013 high of 48.19 in the near future. Looking at the four-hour chart of the VXX in Figure 2, we get a larger-scale view of this trend reversal; note the powerful MACD uptrend and that the KnowVera Research Trend Channel has also made its first bullish crossover in more than seven weeks. Note also that the last time the VXX closed above its 10-period moving average (dashed gold line) was also more than seven weeks ago. When/if the November 2013 high of 48.19 is taken out, the stage will be set for this market volatility ETF to rise up toward either of the two dashed resistance lines, up near the 53.00 and 54.00 area, respectively. |

|
| Figure 2. The 4-hour chart of VXX reveals a bullish MACD configuration, positive DMI and a bullish KnowVera Research Trend Channel crossover. The next resistances of import are near 53.00 and 54.00 for the VXX. |
| Graphic provided by: Phantom Trader by KnowVera Research LLC. |
| |
| Playing VXX here might involve something as simple as waiting for the 48.19 level to be breached to the upside and then waiting for a modest pullback to initiate a new long position, using a nine to 10 bar simple moving average as your trailing stop on the four-hour time frame chart. Hold the long trade until either the four-hour MACD goes bearish, the trailing stop is breached or you see VXX hit the first resistance at 53.00; those would all make excellent exit strategies, depending on your level of risk tolerance and account size. Try to keep your account risk at no more than 1% and monitor all intraday trades closely at all times. Trade wisely until we meet here again. |
Freelance financial markets writer and online publisher of the Trendzetterz.com S&P 500 Weekly Forecast service.
| Title: | Market consultant and writer |
| Company: | Trendzetterz |
| Address: | 81 Hickory Hollow Drive |
| Crossville, TN 38555 | |
| Phone # for sales: | 904-303-4814 |
| Website: | trendzetterz.com |
| E-mail address: | support@trendzetterz.com |
Traders' Resource Links | |
| Trendzetterz has not added any product or service information to TRADERS' RESOURCE. | |
Click here for more information about our publications!
Comments
Date: 12/13/13Rank: 5Comment: Well done Donald. A very good article.
Cheers
Matt Blackman

|

Request Information From Our Sponsors
- StockCharts.com, Inc.
- Candle Patterns
- Candlestick Charting Explained
- Intermarket Technical Analysis
- John Murphy on Chart Analysis
- John Murphy's Chart Pattern Recognition
- John Murphy's Market Message
- MurphyExplainsMarketAnalysis-Intermarket Analysis
- MurphyExplainsMarketAnalysis-Visual Analysis
- StockCharts.com
- Technical Analysis of the Financial Markets
- The Visual Investor
- VectorVest, Inc.
- Executive Premier Workshop
- One-Day Options Course
- OptionsPro
- Retirement Income Workshop
- Sure-Fire Trading Systems (VectorVest, Inc.)
- Trading as a Business Workshop
- VectorVest 7 EOD
- VectorVest 7 RealTime/IntraDay
- VectorVest AutoTester
- VectorVest Educational Services
- VectorVest OnLine
- VectorVest Options Analyzer
- VectorVest ProGraphics v6.0
- VectorVest ProTrader 7
- VectorVest RealTime Derby Tool
- VectorVest Simulator
- VectorVest Variator
- VectorVest Watchdog
