

HOT TOPICS LIST
- MACD
- Fibonacci
- RSI
- Gann
- ADXR
- Stochastics
- Volume
- Triangles
- Futures
- Cycles
- Volatility
- ZIGZAG
- MESA
- Retracement
- Aroon
INDICATORS LIST
LIST OF TOPICS
PRINT THIS ARTICLE
by Chaitali Mohile
Repros Therapeutics has a few resistance levels and gaps to fill.
Position: N/A
Chaitali Mohile
Active trader in the Indian stock markets since 2003 and a full-time writer. Trading is largely based upon technical analysis.
PRINT THIS ARTICLE
SUPPORT & RESISTANCE
Can RPRX Surge In A Bullish Zone?
12/09/13 03:46:23 PMby Chaitali Mohile
Repros Therapeutics has a few resistance levels and gaps to fill.
Position: N/A
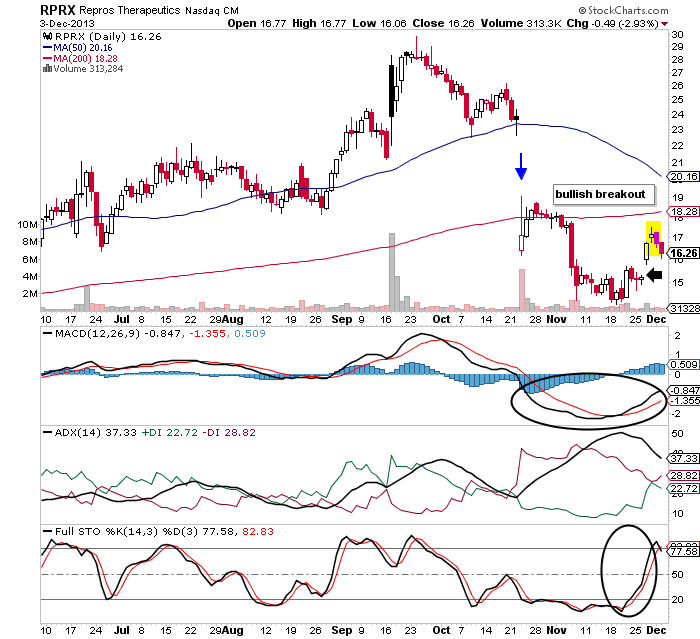
| The 50-day moving average (MA) on the chart of Repros Therapeutics (RPRX) extended robust support to the volatile rally of the stock price. This short-term technical support was challenged frequently but the existing bullish pressure pulled the stock upward. Due to high volatility, bullish pressure was diminishing, resulting in a weak uptrend development. Eventually, the 50-day MA support was breached with a huge gap down in the month of October. This bearish breakout did some damage to the stock price as the rally plunged below the 200-day moving average (MA) support. Thereafter, RPRX remained under bearish influence. |
|
| Figure 1. Daily chart of RPRX. |
| Graphic provided by: StockCharts.com. |
| |
| In the meantime, the full stochastic (14,3,3) became highly oversold, the average directional index (ADX)(14) reached overheated downtrend levels, and the negative moving average convergence/divergence (MACD) (12,26,9) underwent a bullish crossover in positive territory. These indicators suggested a bullish reversal rally. We can see a rounded bottom bullish reversal formation in Figure 1. RPRX witnessed a small gap during the formation of the rounded bottom. The pattern has to breach the 200-day MA resistance for a bullish breakout. An overheated downtrend is reversing and the bullish pressure indicated by the positive directional index (+DI) is gaining strength. The other two indicators are rallying toward their respective bullish areas. |
| Apart from moving average resistance, RPRX would face a psychological resistance created by the previous gap down. In addition, the stock has freshly formed a short-term bearish engulfing pattern in Figure 1(see the yellow block). In such a scenario, it would be difficult for the indicators to sustain their bullish levels. Hence traders have to stay watchful for the confirmed breakout. |
|
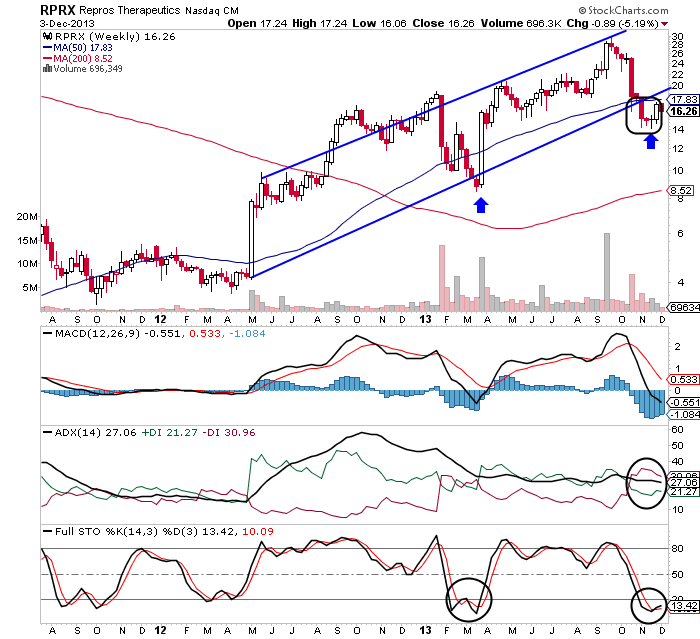
| Figure 2. Weekly chart of RPRX. |
| Graphic provided by: StockCharts.com. |
| |
| RPRX has been moving in an ascending channel on the weekly time frame chart in Figure 2. The stock has violated the lower trendline as well as the 50-day MA support. The stock is now struggling to regain support. The bearish breakout of an ascending channel is a trend reversal indication. The ADX(14) in Figure 2 is showing the same trend reversal conditions. The long-term uptrend is replaced by a developing downtrend for RPRX. The oversold stochastic oscillator is suggesting a bullish pullback rally. The MACD(12,26,9) has established support in positive territory. Although the momentum oscillator had surged from the oversold levels earlier in Figure 2, we need to wait for the confirmed rally. |
| Currently, RPRX is forming a bottom by consolidating below the two technical resistances. To conclude, the stock is unable to undergo a bullish breakout. The indicators and price action of RPRX are not yet showing enough strength to indicate price breaking above its various resistance levels. |
Active trader in the Indian stock markets since 2003 and a full-time writer. Trading is largely based upon technical analysis.
| Company: | Independent |
| Address: | C1/3 Parth Indraprasth Towers. Vastrapur |
| Ahmedabad, Guj 380015 | |
| E-mail address: | chaitalimohile@yahoo.co.in |
Traders' Resource Links | |
| Independent has not added any product or service information to TRADERS' RESOURCE. | |
Click here for more information about our publications!
Comments

Request Information From Our Sponsors
- StockCharts.com, Inc.
- Candle Patterns
- Candlestick Charting Explained
- Intermarket Technical Analysis
- John Murphy on Chart Analysis
- John Murphy's Chart Pattern Recognition
- John Murphy's Market Message
- MurphyExplainsMarketAnalysis-Intermarket Analysis
- MurphyExplainsMarketAnalysis-Visual Analysis
- StockCharts.com
- Technical Analysis of the Financial Markets
- The Visual Investor
- VectorVest, Inc.
- Executive Premier Workshop
- One-Day Options Course
- OptionsPro
- Retirement Income Workshop
- Sure-Fire Trading Systems (VectorVest, Inc.)
- Trading as a Business Workshop
- VectorVest 7 EOD
- VectorVest 7 RealTime/IntraDay
- VectorVest AutoTester
- VectorVest Educational Services
- VectorVest OnLine
- VectorVest Options Analyzer
- VectorVest ProGraphics v6.0
- VectorVest ProTrader 7
- VectorVest RealTime Derby Tool
- VectorVest Simulator
- VectorVest Variator
- VectorVest Watchdog