HOT TOPICS LIST
- MACD
- Fibonacci
- RSI
- Gann
- ADXR
- Stochastics
- Volume
- Triangles
- Futures
- Cycles
- Volatility
- ZIGZAG
- MESA
- Retracement
- Aroon
INDICATORS LIST
LIST OF TOPICS
PRINT THIS ARTICLE
by Donald W. Pendergast, Jr.
The latest three-month rally in shares of Southwest Airlines is correcting, as are those of other airline stocks.
Position: N/A
Donald W. Pendergast, Jr.
Freelance financial markets writer and online publisher of the Trendzetterz.com S&P 500 Weekly Forecast service.
PRINT THIS ARTICLE
REVERSAL
Southwest Airlines: Change Of Flight Plan
12/04/13 04:37:46 PMby Donald W. Pendergast, Jr.
The latest three-month rally in shares of Southwest Airlines is correcting, as are those of other airline stocks.
Position: N/A
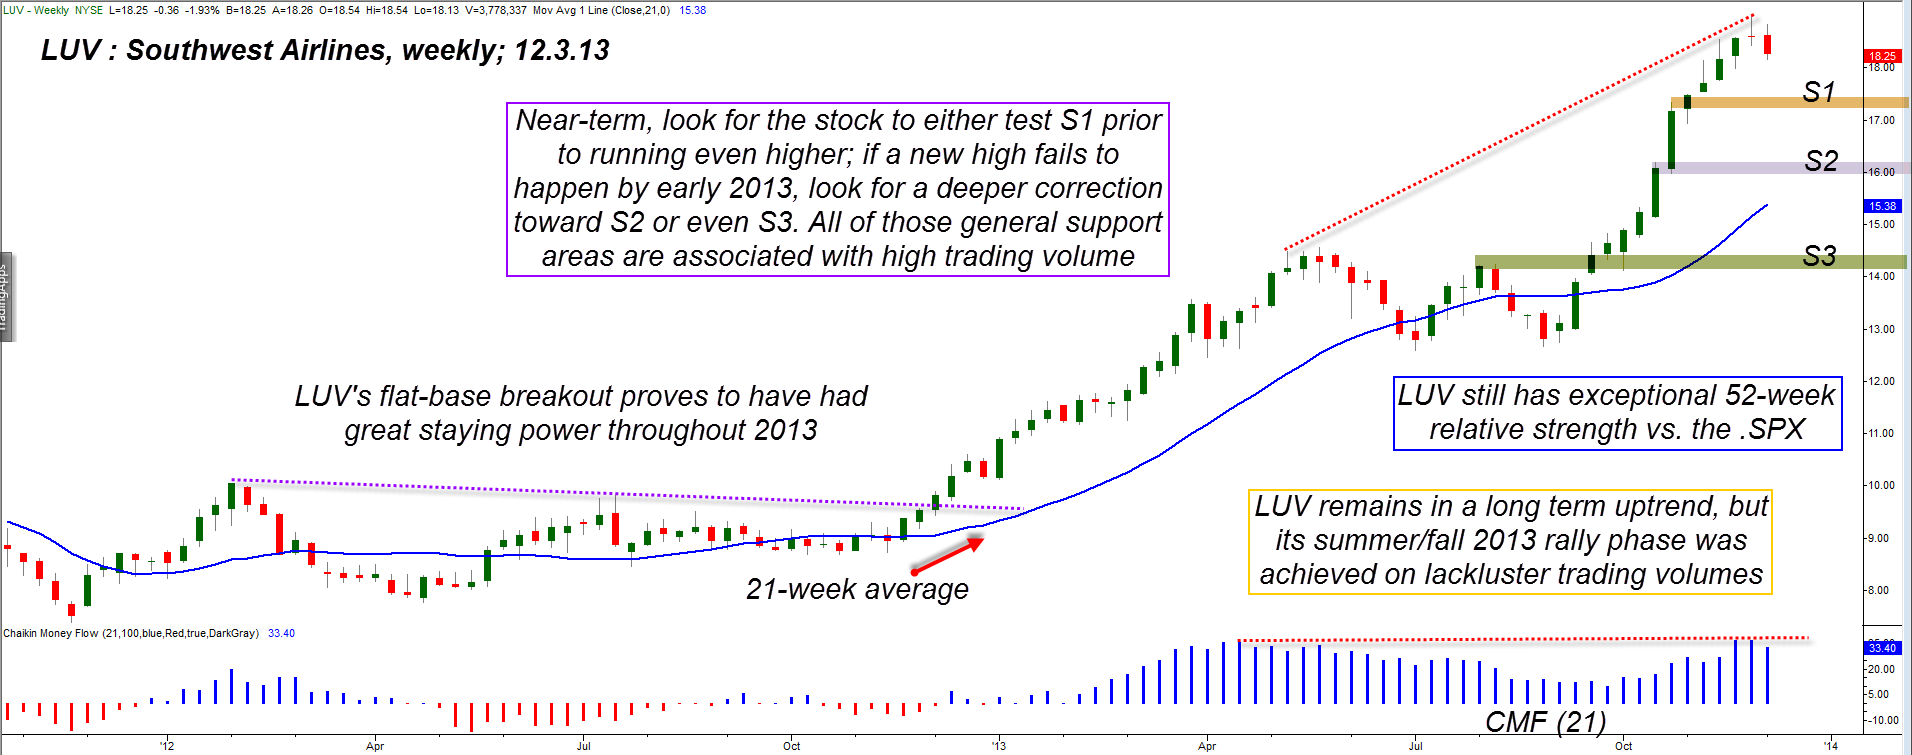
| Since emerging from a well-formed flat base breakout pattern in late 2012, shares of Southwest Airlines (LUV) have literally soared — gaining more than 80% in one year. The second half of that great rally which commenced in September 2013 was the most powerful in terms of percentage gains per month, but lacked the volume needed to maintain its high angle of attack. Here's a closer look at LUV's weekly chart (Figure 1), along with an idea of how to play the stock if it hits its anticipated support levels soon. |

|
| Figure 1. LUV's latest rally was made on modest volume, making a correction likely — and here it is, underway right now. S1 may or may not provide a strong weekly chart bounce, whereas S2 should be an area to expect a solid daily/weekly chart rally. |
| Graphic provided by: TradeStation. |
| |
| Long-term (position) traders and investors tend to focus on weekly and monthly charts to get a big picture view of the price patterns, trends, and support/resistance dynamics in the markets they follow; had they been studying the weekly chart of LUV around this time last year, they would have seen the beautiful flat-base breakout setup on LUV's weekly chart, one that led to the stunning bullish run in the stock throughout 2013. Astute technicians know that flat-base breakouts in fundamentally sound stocks (and commodity markets) can offer a great, low-risk, high reward opportunity for those who know how to size positions properly and who have the patience needed for a long-term trend to ultimately play out. Traders who possessed patience were certainly well-rewarded if they stayed with LUV over the past year, but the tide appears to be turning for this major US air carrier's stock — at least for the next month or two at a minimum. Here's why: 1. The trading volume during the second wave higher into the November 2013 high was noticeably less than during the first December 2102 - May 2013 rally, as evidenced by the equal money flow histogram highs (CMF)(21). 2. LUV also climbed, way above its 21-week simple moving average compared to most previous rallies, suggesting that a peak was near. 3. With the Dow 30 (DIA), S&P 500 (SPY) all making Elliot fifth waves as they continued to make record highs, LUV had become a "poster child" for the speculative excesses driving the entire market higher and was a stock "priced to perfection." Obviously, at some point, even the strongest trend in a fundamentally solid (steady earnings growth, etc.) stock will need to pause, consolidate, or even correct to wring out the speculative excess, and at some point a complete trend reversal from bullish to bearish will ensue once a company's earnings growth rate trend begins to disintegrate. LUV still looks attractive from a fundamental viewpoint, but for the moment its least line of resistance is for it to pullback and test one, if not more, of the following support levels: 1. S1 - if the bulls are super confident that LUV can manage yet another new high by the first quarter of 2014, they they will likely initiate new long positions near S1 which ranges from 17.20 to 17.35. A sharp rally after S1 is reached might make a strong case for LUV to make a quick run back up to its recent high at 18.97. 2. S2 - if S1 provides only modest support and is broken soon after, expect a deeper correction (like an Elliott Wave A-B-C) down to the next cluster of high volume price zones, near 15.95 to 16.10. S2 could be a good area from which to time a short-covering rally, should the stock fall to that level in early 2014. 3. Finally, S3 - if LUV declines rapidly to this level (near 14.10 to 14.25) assume that the long-term uptrend is history and play the stock from whatever side offers the lowest risk to reward ratio. If the major US stock indexes really take a hit between now and the end of Q1 2014, LUV is going to get pulled lower, too, so always monitor the current trend in DIA, QQQ, IWM, and SPY to make sure your stock trades are going in the same general direction as the major indexes. |

|
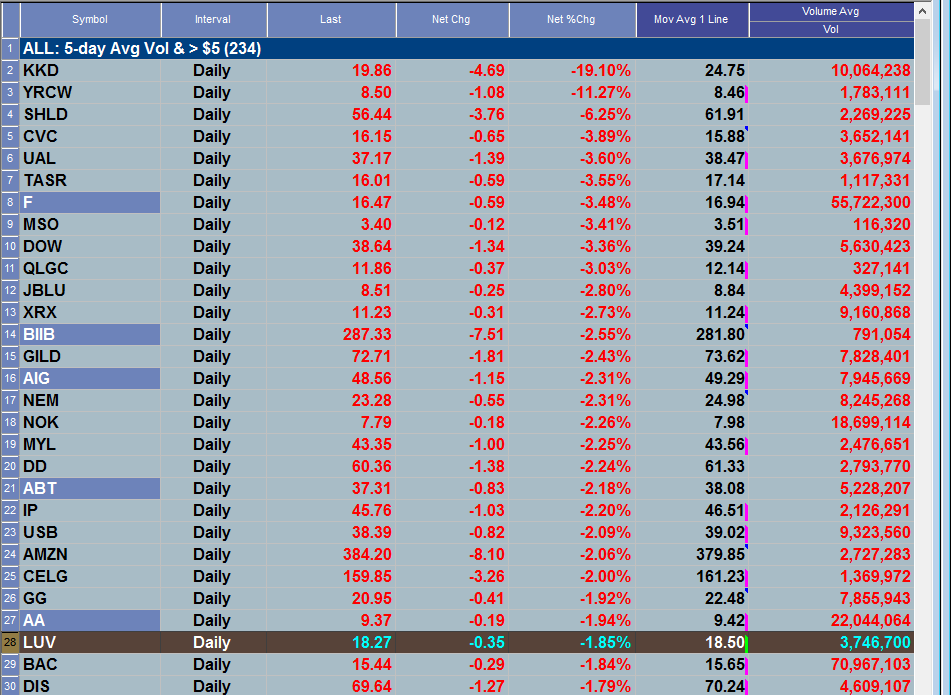
| Figure 2. A lot of high volume stocks were bleeding red ink on Tuesday December 3, 2013, including shares of Southwest Airlines (LUV). |
| Graphic provided by: TradeStation. |
| |
| For those lacking the patience to wait for LUV's next low-risk buying opportunity, the use of long puts here might be one smart way to play a potential run down toward S1 or even S2. The puts should have more than enough time value for the anticipated decline to take place — for example, if you believe LUV is likely to hit S1 within the next three weeks you should buy a put with at least two to three months time value until expiration. Similarly, if you feel confident LUV is destined to meet up with S2 within the next two months, buy a put with at least four months of remaining time value. You always want plenty of time value so that you don't get stuck with an option that has accelerating time decay working against you while still waiting for the move to play out. Generally, if buying long calls or puts, buy an option that has at least twice as much time value as you reasonably believe it will take for the move in the stock to complete. If buying puts now, risk no more than 1% of your account value, no matter how short-term bearish you are on this stock. Trade wisely until we meet here again. |
Freelance financial markets writer and online publisher of the Trendzetterz.com S&P 500 Weekly Forecast service.
| Title: | Market consultant and writer |
| Company: | Trendzetterz |
| Address: | 81 Hickory Hollow Drive |
| Crossville, TN 38555 | |
| Phone # for sales: | 904-303-4814 |
| Website: | trendzetterz.com |
| E-mail address: | support@trendzetterz.com |
Traders' Resource Links | |
| Trendzetterz has not added any product or service information to TRADERS' RESOURCE. | |
Click here for more information about our publications!
PRINT THIS ARTICLE

|

Request Information From Our Sponsors
- StockCharts.com, Inc.
- Candle Patterns
- Candlestick Charting Explained
- Intermarket Technical Analysis
- John Murphy on Chart Analysis
- John Murphy's Chart Pattern Recognition
- John Murphy's Market Message
- MurphyExplainsMarketAnalysis-Intermarket Analysis
- MurphyExplainsMarketAnalysis-Visual Analysis
- StockCharts.com
- Technical Analysis of the Financial Markets
- The Visual Investor
- VectorVest, Inc.
- Executive Premier Workshop
- One-Day Options Course
- OptionsPro
- Retirement Income Workshop
- Sure-Fire Trading Systems (VectorVest, Inc.)
- Trading as a Business Workshop
- VectorVest 7 EOD
- VectorVest 7 RealTime/IntraDay
- VectorVest AutoTester
- VectorVest Educational Services
- VectorVest OnLine
- VectorVest Options Analyzer
- VectorVest ProGraphics v6.0
- VectorVest ProTrader 7
- VectorVest RealTime Derby Tool
- VectorVest Simulator
- VectorVest Variator
- VectorVest Watchdog
