HOT TOPICS LIST
- MACD
- Fibonacci
- RSI
- Gann
- ADXR
- Stochastics
- Volume
- Triangles
- Futures
- Cycles
- Volatility
- ZIGZAG
- MESA
- Retracement
- Aroon
INDICATORS LIST
LIST OF TOPICS
PRINT THIS ARTICLE
by Koos van der Merwe
Christmas is around the corner. What do you buy someone who has everything?
Position: Accumulate
Koos van der Merwe
Has been a technical analyst since 1969, and has worked as a futures and options trader with First Financial Futures in Johannesburg, South Africa.
PRINT THIS ARTICLE
FLAGS AND PENNANTS
A Lulu Of A Stock
12/02/13 04:12:09 PMby Koos van der Merwe
Christmas is around the corner. What do you buy someone who has everything?
Position: Accumulate
| The answer of course is a "Lulu", and by this I mean a gift voucher to buy something at Lululemon. There is no doubt in anyone's mind that what Lululemon sells is extremely popular, especially with those ladies that are gym or yoga enthusiasts. With Christmas a stone's throw away, buying the share could be a winner. |

|
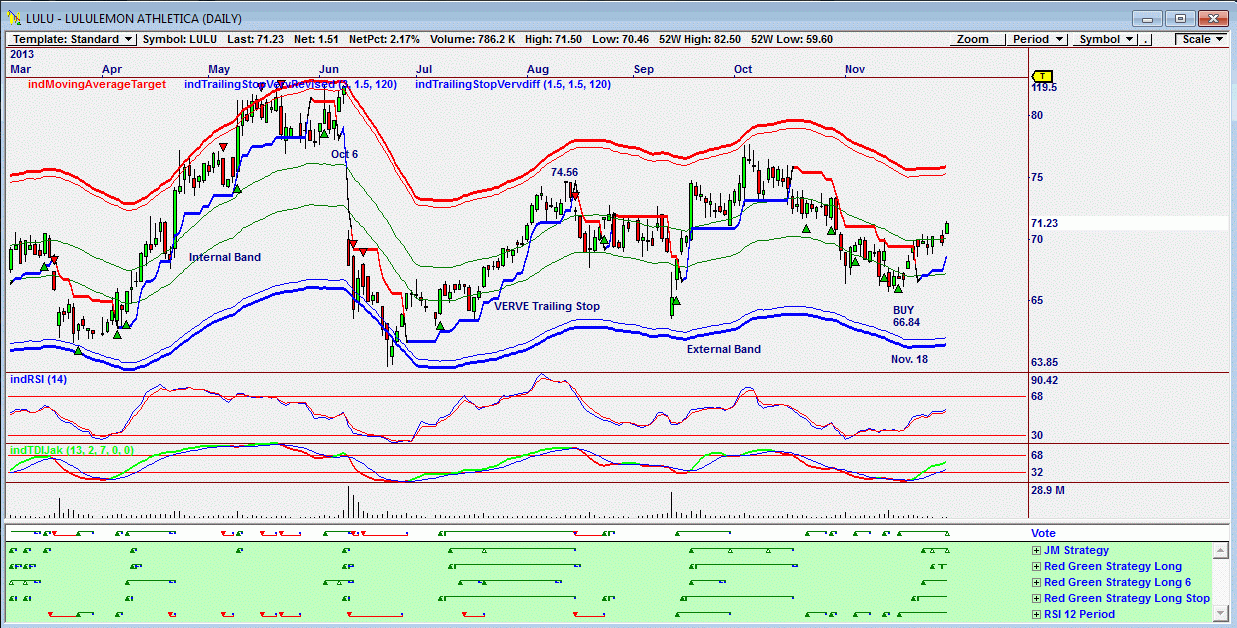
| Figure 1. Omnitrader chart showing a buy signal. |
| Graphic provided by: Omnitrader. |
| |
| The chart in Figure 1 is an Omnitrader chart showing a buy signal given on November 18, 2013 when the price was $66.84. The buy signal was based on the RSI 12-period strategy. Note how the Red Green and JM Strategies started to give buy signals a few days later, supporting the original buy signal given. Note how the share price fell strongly on October 6, 2013 when the company recalled one of its lines because it was "see through." The share price fell from a high of $82.28 to $64.30 in two days. Of course the share price rose to "fill that gap," rising to a high of $74.56 before falling back, but since then, the share price has moved sideways, tracking the internal and external bands. |

|
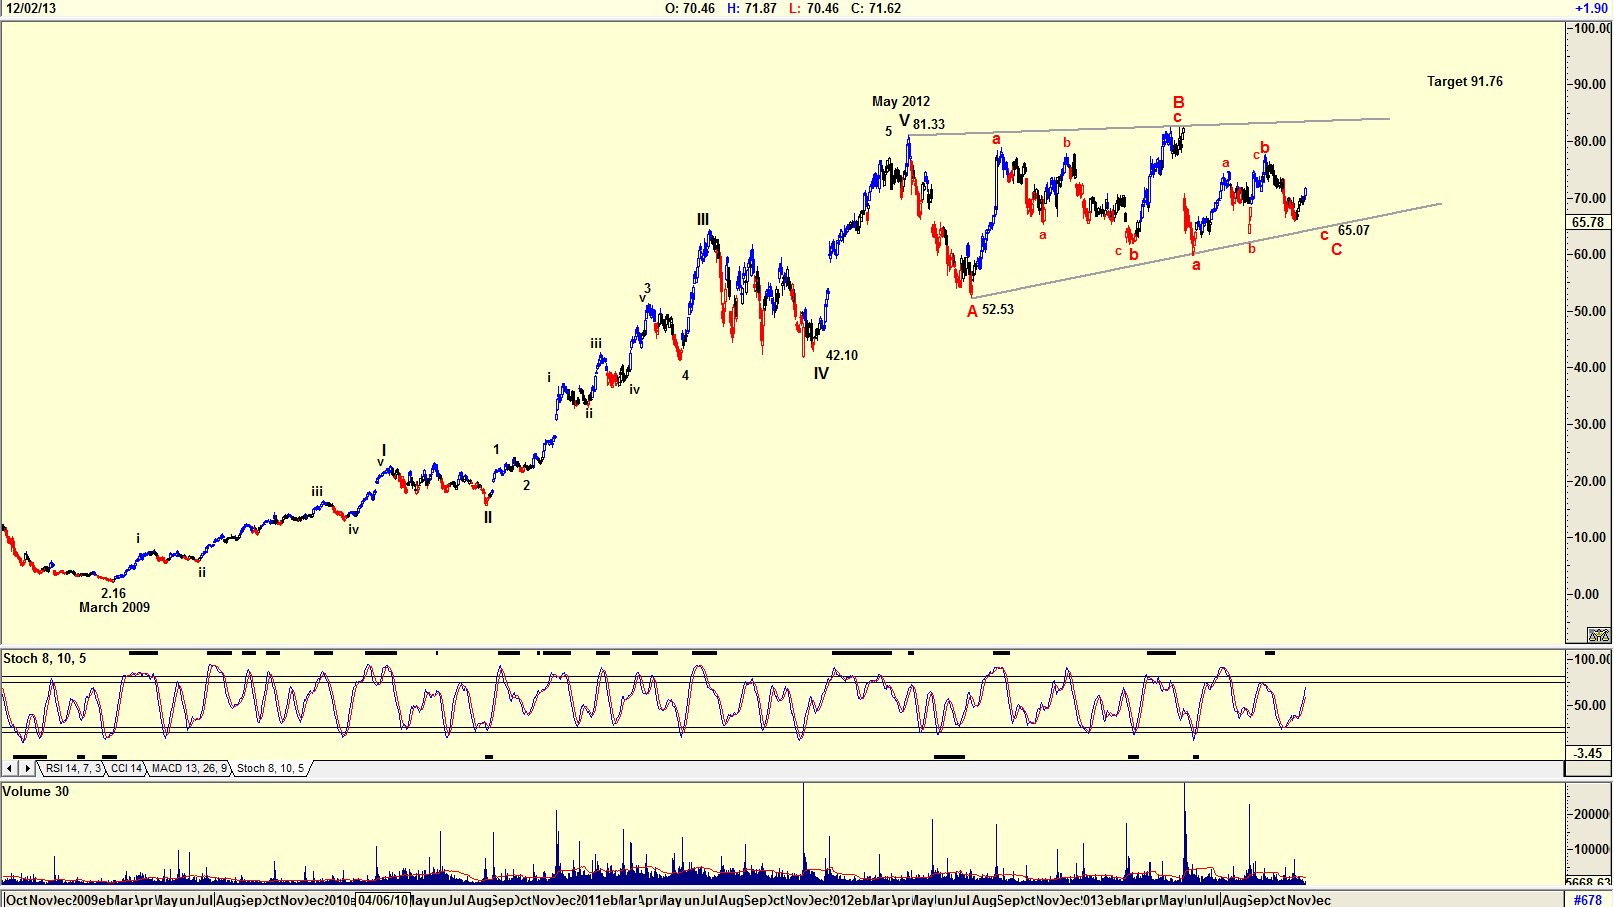
| Figure 2. Elliott Wave count of Lululemon with a possible pennant formation. |
| Graphic provided by: AdvancedGET. |
| |
| The daily chart in Figure 2 shows an Elliott Wave count. The count suggests that the share price is tracing an ABC correction. However, the pattern that has formed looks like a broad pennant. A pennant is similar to a flag, except that it is bounded by converging rather than parallel lines rather than parallel lines. Both a flag and pennant are considered to be periods of consolidation. In order to be considered valid, a pennant should conform three rules: 1. They should occur after a very sharp up move. 2. Volume should decline throughout the duration of the pattern 3. Price should break out of the pattern within the matter of a few weeks. Should this truly be a pennant that is forming, then the May 2012 WAVE V top could be incorrect. The target suggested is $91.76 (81.33-42.10+ 52.53) which means that WAVE V could possible top out at $91.76. I would be a buyer of Lululemon at the present price for a hold to a target of $91.76. The chart of Figure 2 is suggesting that the price could drop to the lower line of the pennant in the region of $65.07, suggesting that one should wait for the drop to this level. With the chart in Figure 1 suggesting a BUY now, and the chart in Figure 2 suggesting that one should wait, it could be a good idea to buy half of what one intends to buy now, and the balance should the share drop to the $65 level. |
Has been a technical analyst since 1969, and has worked as a futures and options trader with First Financial Futures in Johannesburg, South Africa.
| Address: | 3256 West 24th Ave |
| Vancouver, BC | |
| Phone # for sales: | 6042634214 |
| E-mail address: | petroosp@gmail.com |
Click here for more information about our publications!
PRINT THIS ARTICLE

Request Information From Our Sponsors
- StockCharts.com, Inc.
- Candle Patterns
- Candlestick Charting Explained
- Intermarket Technical Analysis
- John Murphy on Chart Analysis
- John Murphy's Chart Pattern Recognition
- John Murphy's Market Message
- MurphyExplainsMarketAnalysis-Intermarket Analysis
- MurphyExplainsMarketAnalysis-Visual Analysis
- StockCharts.com
- Technical Analysis of the Financial Markets
- The Visual Investor
- VectorVest, Inc.
- Executive Premier Workshop
- One-Day Options Course
- OptionsPro
- Retirement Income Workshop
- Sure-Fire Trading Systems (VectorVest, Inc.)
- Trading as a Business Workshop
- VectorVest 7 EOD
- VectorVest 7 RealTime/IntraDay
- VectorVest AutoTester
- VectorVest Educational Services
- VectorVest OnLine
- VectorVest Options Analyzer
- VectorVest ProGraphics v6.0
- VectorVest ProTrader 7
- VectorVest RealTime Derby Tool
- VectorVest Simulator
- VectorVest Variator
- VectorVest Watchdog
