HOT TOPICS LIST
- MACD
- Fibonacci
- RSI
- Gann
- ADXR
- Stochastics
- Volume
- Triangles
- Futures
- Cycles
- Volatility
- ZIGZAG
- MESA
- Retracement
- Aroon
INDICATORS LIST
LIST OF TOPICS
PRINT THIS ARTICLE
by Donald W. Pendergast, Jr.
The oil services group is likely at the start of another rally phase as 2013 comes to a close.
Position: N/A
Donald W. Pendergast, Jr.
Freelance financial markets writer and online publisher of the Trendzetterz.com S&P 500 Weekly Forecast service.
PRINT THIS ARTICLE
REVERSAL
OIH: Intraday Bullish Reversal
12/02/13 04:02:59 PMby Donald W. Pendergast, Jr.
The oil services group is likely at the start of another rally phase as 2013 comes to a close.
Position: N/A
| Oil service industry group stocks appear to have completed a proportional correction of their late summer/early fall rally and may now be in the early phase of another bullish rally — one that could run into late December 2013 or early 2014. Here's a closer look. |

|
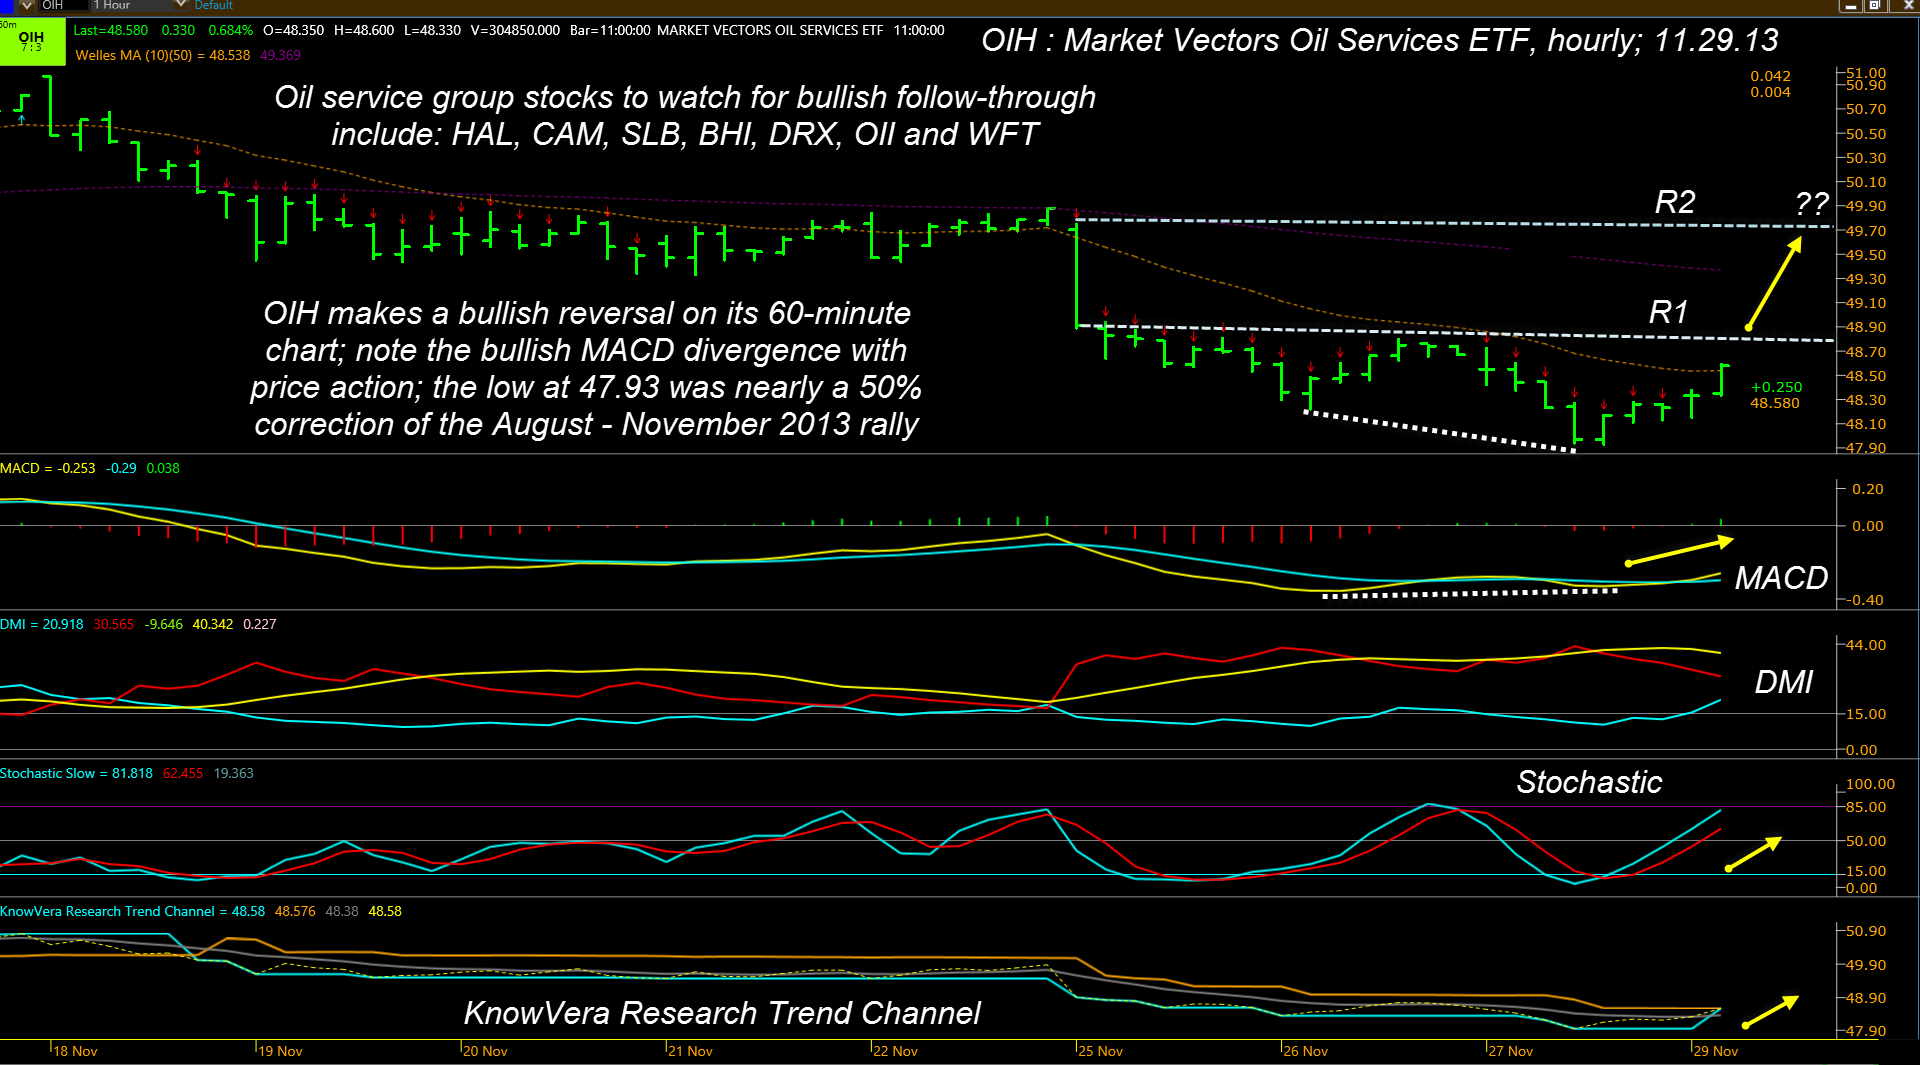
| Figure 1. OIH begins to turn higher on its hourly chart; the probabilities of a steady move higher toward R2 will be enhanced if crude oil futures also follow through with their own bullish reversal. |
| Graphic provided by: Phantom Trader by KnowVera Research LLC. |
| |
| For swing traders, stocks within the oil services industry group are prized for their ability to make tradable swing moves that can lead to consistent profits, and that their general trend direction is linked to one of the world's most actively traded commodities — crude oil — also makes them easier to trade from a fundamental (supply/demand) vantage. The Market Vectors Oil Services ETF (OIH) has rallied strongly for more than a year now, rising at a measured pace along with the S&P 500 index (.SPX) since its November 2012 major multicycle low of 36.24 and managed to rally all the way up to 51.11 on November 15, 2013 for a maximum gain of better than 41% in just 51 weeks. Now, with a proportional correction of approximately 50% of the August-November 2013 portion of the major rally complete, OIH is starting to reverse higher again on its 60-minute time frame (Figure 1): 1. A bullish MACD divergence has been resolved, with OIH breaking back above its 10-period moving average. 2. OIH has completed a test of Fibonacci 24% support of the rally that commenced in November 2012. This usually means a tradable bounce — and another run higher toward the recent highs of 51.11 is probable, as late-stage buyers (the dumb money) pile in, driving the stock up in one final thrust before a more notable correction occurs on the daily time frame. 3. Crude oil is also giving indications that its steep slide since early September 2013 is now close to ending, and the long-term seasonal charts confirm that crude oil (@CL) typically bottoms out between late November and early December with a high degree of consistency. A turn higher by crude oil should help propel OIH back up to its recent highs as we head into December 2013. 4. The stochastic on the 60-minute OIH chart are confirming that there is real strength underlying this fresh turn higher in this key energy ETF. |

|
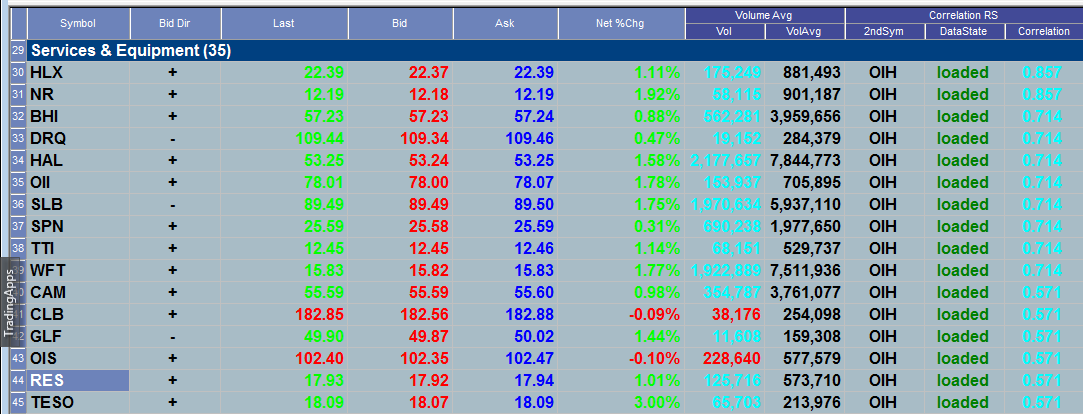
| Figure 2. A list of the stocks most closely correlated with OIH; note that most of them are moving higher along with OIH. Trading the strongest relative strength stocks within an industry group that is turning higher is still a valid trading strategy, one that will never go out of style. |
| Graphic provided by: TradeStation. |
| Graphic provided by: TradeStation Radar Screen. |
| |
| Looking at the 60-minute chart, once OIH can finally clear the R1 (resistance) at 48.80, pull back slightly and then close back above that level, it should have fairly smooth sailing up towards R2, which is near 49.75. R2 also coincides with the 50-day moving average in OIH, and should be a notable area of resistance. Traders may want to put on about a third of their long position now, another third as 48.80 is breached to the upside, and then the final third once OIH rises above 48.90. If that all occurs soon, the ETF should be in good position to rally back up to R2, especially if crude oil makes good on its latest bullish reversal pattern on its daily chart. Traders should use a nine or 10-bar simple moving average to trail such a long position, as that may provide some "back and fill" room for the anticipated trend to develop; most if not all profits should be taken if OIH gets closer to R2. As this is a reversal trade, account risk should be kept at 1% or less, depending on your risk tolerance. Trade wisely until we meet here again. |
Freelance financial markets writer and online publisher of the Trendzetterz.com S&P 500 Weekly Forecast service.
| Title: | Market consultant and writer |
| Company: | Trendzetterz |
| Address: | 81 Hickory Hollow Drive |
| Crossville, TN 38555 | |
| Phone # for sales: | 904-303-4814 |
| Website: | trendzetterz.com |
| E-mail address: | support@trendzetterz.com |
Traders' Resource Links | |
| Trendzetterz has not added any product or service information to TRADERS' RESOURCE. | |
Click here for more information about our publications!
Comments

Request Information From Our Sponsors
- StockCharts.com, Inc.
- Candle Patterns
- Candlestick Charting Explained
- Intermarket Technical Analysis
- John Murphy on Chart Analysis
- John Murphy's Chart Pattern Recognition
- John Murphy's Market Message
- MurphyExplainsMarketAnalysis-Intermarket Analysis
- MurphyExplainsMarketAnalysis-Visual Analysis
- StockCharts.com
- Technical Analysis of the Financial Markets
- The Visual Investor
- VectorVest, Inc.
- Executive Premier Workshop
- One-Day Options Course
- OptionsPro
- Retirement Income Workshop
- Sure-Fire Trading Systems (VectorVest, Inc.)
- Trading as a Business Workshop
- VectorVest 7 EOD
- VectorVest 7 RealTime/IntraDay
- VectorVest AutoTester
- VectorVest Educational Services
- VectorVest OnLine
- VectorVest Options Analyzer
- VectorVest ProGraphics v6.0
- VectorVest ProTrader 7
- VectorVest RealTime Derby Tool
- VectorVest Simulator
- VectorVest Variator
- VectorVest Watchdog
