

HOT TOPICS LIST
- MACD
- Fibonacci
- RSI
- Gann
- ADXR
- Stochastics
- Volume
- Triangles
- Futures
- Cycles
- Volatility
- ZIGZAG
- MESA
- Retracement
- Aroon
INDICATORS LIST
LIST OF TOPICS
PRINT THIS ARTICLE
by Donald W. Pendergast, Jr.
Shares of grocery giant Kroger Co. have been in a sideways range for the last two weeks after having made an all-time high -- which way next for Kroger?
Position: N/A
Donald W. Pendergast, Jr.
Freelance financial markets writer and online publisher of the Trendzetterz.com S&P 500 Weekly Forecast service.
PRINT THIS ARTICLE
CONSOLID FORMATION
Kroger: Consolidating But Bearish Breadown Possible
11/27/13 04:01:06 PMby Donald W. Pendergast, Jr.
Shares of grocery giant Kroger Co. have been in a sideways range for the last two weeks after having made an all-time high -- which way next for Kroger?
Position: N/A
| Kroger Co. (KR) shares have been in an astounding rally for 16 months now; after bottoming in July 2012 at 20.98, the stock went on a tear, skyrocketing up to 43.85 in October 2013 — a gain of more than 109% at one point. It has been the strongest sustained bull run in the stock since the late 1990's, which was the last time it went parabolic on its monthly time frame. Here's a look at the daily and monthly chart of Kroger now, along with an idea on how to play a possible short-term and/or long-term reversal in this stock. |
|
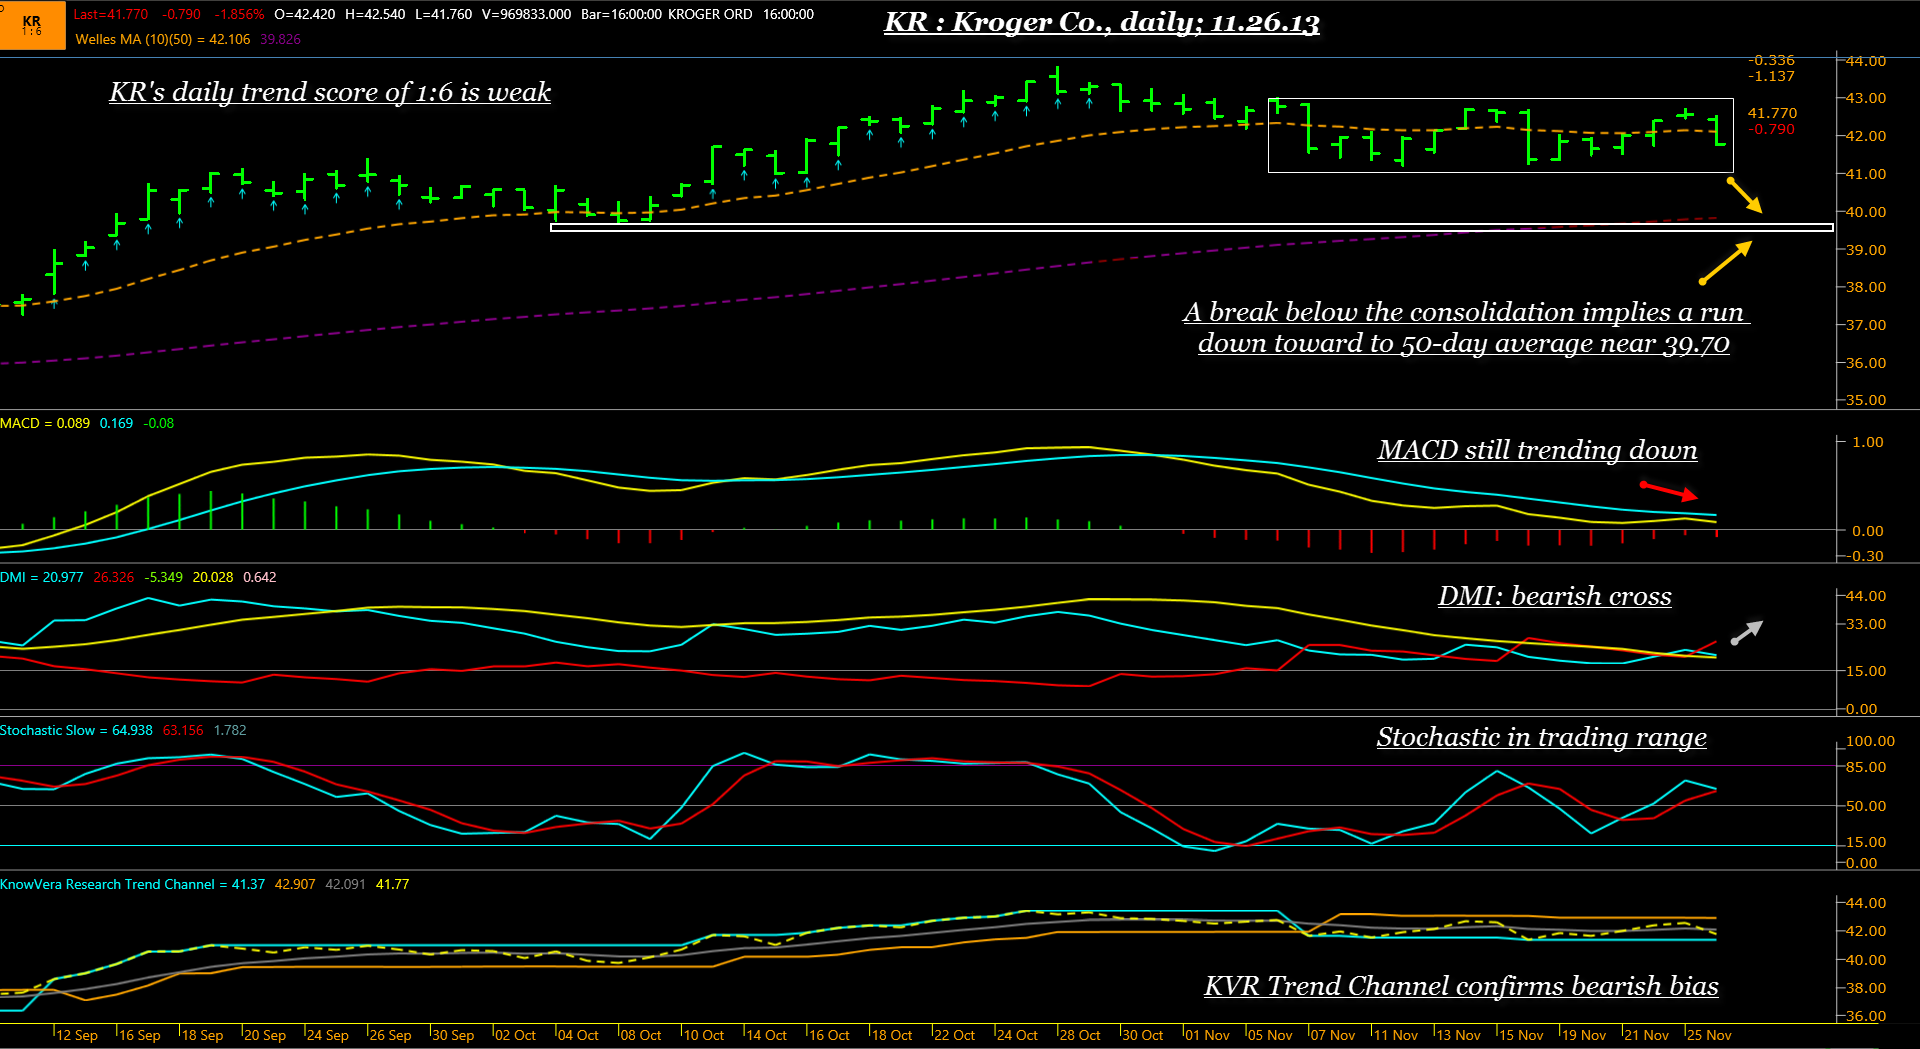
| Figure 1. Kroger's (KR) daily chart reveals an image of a stock in a trading range, but one that also has increasing downside momentum. |
| Graphic provided by: Phantom Trader by KnowVera Research LLC. |
| |
| KR's daily chart shows us an image of a stock in a near-term trading range; the DMI (Directional Movement) has crossed to the bearish side, the MACD is still trending lower and the KnowVera Trend Channel is still confirming a bearish trend on the daily time frame. So the momentum is strongly biased to the downside at this time, and a break down below the lower end of the range should see KR descend toward key daily support at its 50-day average (currently near 39.70). Aggressive traders might try to put on a small short position on a break below 41.70 and then put on the balance on a drop beneath 41.20. This trade setup may work better if you see the S&P 500 index (.SPX, SPY) also breaking lower; should KR hit 39.75 quickly, consider taking most if not all of your profits and waiting for another daily time frame setup to appear. The 34-day Chaikin Money flow histogram (CMF)(34) is still above its zero line and that makes a good case for booking profits near the next closest support level, which is the 50-day average at 39.70. Long term bulls in KR will view the 50-day average as a low-risk buy point, but of course no one knows if KR will rally back and make new highs or just stage a modest bounce, should the 50-day be reached soon. |
|
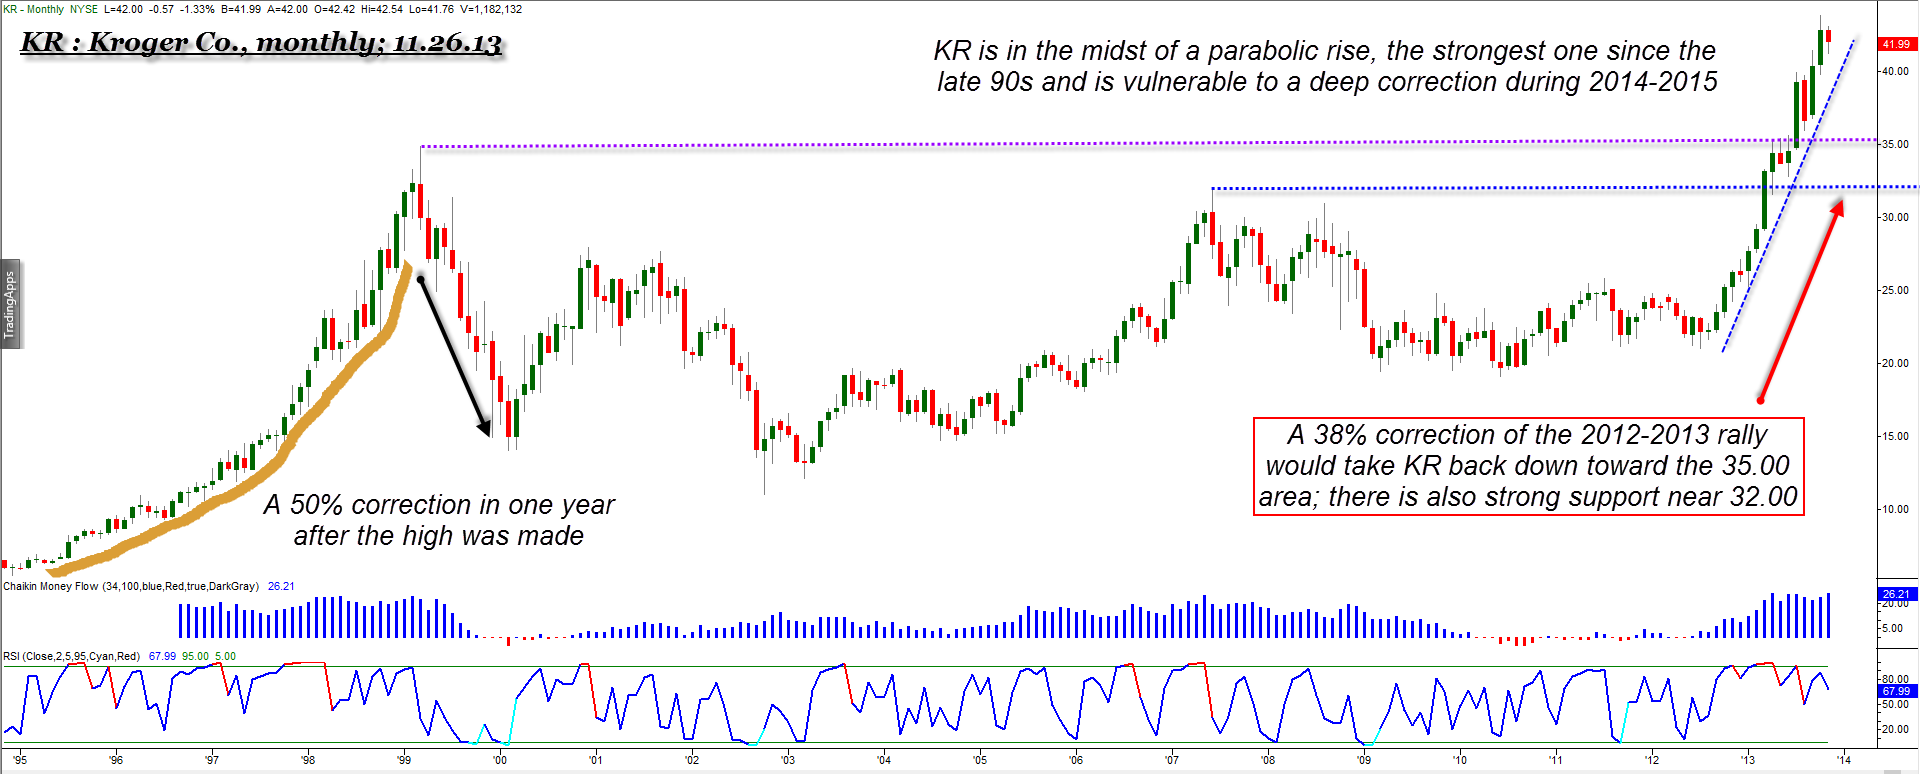
| Figure 2. KR's current rally bears some similarity with its parabolic rise in the late 1990s; note the extreme angle of attack of the latest rally, one that launched in late July 2012. |
| Graphic provided by: TradeStation. |
| |
| KR's monthly chart reveals an image of a stock that is moving sharply higher at an angle of attack that appears to be unsustainable; still, KR could conceivably run even higher before staging a meaningful correction. A break beneath the uptrend line would be the first clear warning that a 24% to 38% correction could be developing; a 38% correction of the July '12 to October '13 rally would bring KR back toward its major $35.00 support area. The parabolic rise of KR in the late 90s did correct by 50% in one year, wiping out all of the gains made in the previous 20 months. If you see KR make a weekly/monthly close below 40.00, that will be a very bearish indication for KR, and you would want to monitor your daily and weekly charts for low-risk short selling points should that occur within the next few weeks or even by early 2014. With so many component stocks in the S&P 500 index at or near record highs now, it might pay to look at some monthly charts of those with the most parabolic-looking patterns and put them on your "major correction due" watch list as we head into 2014, a year that may be one of the most volatile we've seen since the 2007-2009 debacle in the markets. Do your research on each stock with such parabolic trends and then check to see if buying puts or shorting stock is the most attractive pathway; if buying puts make sure you use options with close bid/ask spreads, modest implied volatility and sufficient open interest/trading volume to make it worthwhile. Trade wisely until we meet here again. |
Freelance financial markets writer and online publisher of the Trendzetterz.com S&P 500 Weekly Forecast service.
| Title: | Market consultant and writer |
| Company: | Trendzetterz |
| Address: | 81 Hickory Hollow Drive |
| Crossville, TN 38555 | |
| Phone # for sales: | 904-303-4814 |
| Website: | trendzetterz.com |
| E-mail address: | support@trendzetterz.com |
Traders' Resource Links | |
| Trendzetterz has not added any product or service information to TRADERS' RESOURCE. | |
Click here for more information about our publications!
Comments

Request Information From Our Sponsors
- StockCharts.com, Inc.
- Candle Patterns
- Candlestick Charting Explained
- Intermarket Technical Analysis
- John Murphy on Chart Analysis
- John Murphy's Chart Pattern Recognition
- John Murphy's Market Message
- MurphyExplainsMarketAnalysis-Intermarket Analysis
- MurphyExplainsMarketAnalysis-Visual Analysis
- StockCharts.com
- Technical Analysis of the Financial Markets
- The Visual Investor
- VectorVest, Inc.
- Executive Premier Workshop
- One-Day Options Course
- OptionsPro
- Retirement Income Workshop
- Sure-Fire Trading Systems (VectorVest, Inc.)
- Trading as a Business Workshop
- VectorVest 7 EOD
- VectorVest 7 RealTime/IntraDay
- VectorVest AutoTester
- VectorVest Educational Services
- VectorVest OnLine
- VectorVest Options Analyzer
- VectorVest ProGraphics v6.0
- VectorVest ProTrader 7
- VectorVest RealTime Derby Tool
- VectorVest Simulator
- VectorVest Variator
- VectorVest Watchdog