

HOT TOPICS LIST
- MACD
- Fibonacci
- RSI
- Gann
- ADXR
- Stochastics
- Volume
- Triangles
- Futures
- Cycles
- Volatility
- ZIGZAG
- MESA
- Retracement
- Aroon
INDICATORS LIST
LIST OF TOPICS
PRINT THIS ARTICLE
by Billy Williams
One stock in an overlooked part of the market has great potential for high returns if you know how to trade it.
Position: Buy
Billy Williams
Billy Williams has been trading the markets for 27 years, specializing in momentum trading with stocks and options.
PRINT THIS ARTICLE
STRATEGIES
Overlooked Stocks with Home Run Potential
11/27/13 03:30:34 PMby Billy Williams
One stock in an overlooked part of the market has great potential for high returns if you know how to trade it.
Position: Buy
| Google made big news last month when it joined the "$1,000 Club" when its stock gapped higher on positive earnings being reported for the quarter. The $1,000 Club is an elite club where a few stocks in the universe of the stock market trade above the $1,000 mark and can quickly gain, or lose, hundreds of points in a matter of days. This is rich, fertile ground for trading but on the opposite end of the market, another segment of stocks is easily overlooked yet contains as much, if not more, potential than high-priced stocks. For traders, low-priced stocks under $10 a share are often looked at with disdain where many traders hold their noses at their perceived underwhelming potential. These stocks are often low-priced for obvious reasons — weak fundamentals, small capitalization — but a closer look reveals these reasons are short-sighted and can make you miss gold opportunities as a result. |
|
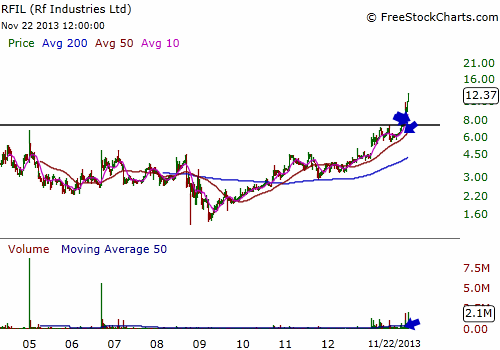
| Figure 1. RFIL traded between $1 to $4 for years and was passed over for investment consideration by institutional traders during this time. |
| Graphic provided by: www.freestockcharts.com. |
| |
| Low-priced, small caps are associated with risk and volatility but they have home run potential that makes them an attractive investment to commit your focus and capital to. Due to their lack of size, they are often passed over by the institutional traders — the real force behind the stock market — simply because they don't meet their investment criteria. A $9 stock may have incredible growth and fundamentals but a small market cap and stock price that keeps it off the radar of the major players who have to follow the guidelines of their investment charter before committing investment capital. That's where good technical skills come in hand, along with the ability to read price action accurately because one can spot where a stock is building a base and where to enter early in the move before the larger investors. Take a look at RF Industries, Ltd. (RFIL), a company based in San Diego, California, that designs, manufactures, and/or sells communications equipment primarily to the radio and other professional communications related industries in the United States and internationally. |
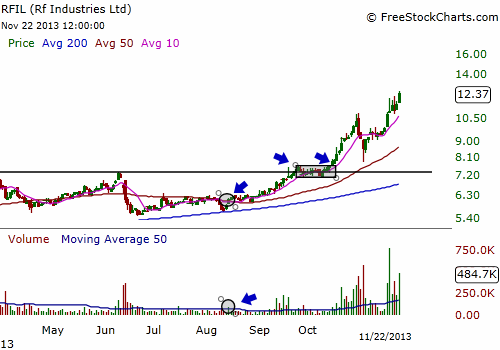
| The company has a market cap of just over $100 million that sports a healthy ROE of almost 23% and no debt. While it should be an attractive investment to long-term investors, its stock price hovered around a $1 until 2009 when it began to trend higher. Looking at the price chart, you can see that volume was almost non-existent up until earlier this year, in January, when the stock gapped higher on volume of over a 1,000% of its 50-day daily average volume. This was a huge indicator that something was happening and, while it wasn't a signal to enter yet, it did warrant your attention. At this point, it was important to look for any type of price consolidation where a first stage base pattern would form and serve as the launching pad for price to trade higher. From January to September, the stock did form a tight trading range that served as its base pattern and a good point to look to enter early. On August 14, 2013, RFIL formed a Pocket Pivot setup where you could have entered early into the move. If you missed that move, there was a second opportunity on September 19, 2013, as the stock traded up through the previous price high or on October 15, 2013, after price consolidated for a few weeks after the breakout. |
|
| Figure 2. The stock started showing a heartbeat this year as volume has begun to rise. The stock offered a few bright spots for entry along the way and has the potential for windfall profits as accumulation begins to rise causing the stock to trend higher. |
| Graphic provided by: www.freestockcharts.com. |
| |
| Any of these entry points would have put you in the stock between $6 to $8, leading to a 50% gain in just a few short weeks, give or take. Now, the big potential of these types of stocks is that they have home run potential if institutional investors begin taking a position and it creates a domino effect where the stock's price gets run up higher and higher. If you'll take a look at the average volume levels in early 2013 to where they are now, you'll see that accumulation is obviously taking place which is a great indicator that the stock might go higher. However, these types of stocks are very volatile which is why you have to maintain tight stops and have solid mastery of technical analysis to help spot when to get in and, more importantly, when to get out. You can see that in early November, the stock had a steep pullback but later recovered and went on to trade higher. But, if you maintain tight risk control and approach trading these stocks with a reliable method then the risk/reward may lead to higher returns for you as well as the potential of catching a home run move before anyone else does. |
Billy Williams has been trading the markets for 27 years, specializing in momentum trading with stocks and options.
| Company: | StockOptionSystem.com |
| E-mail address: | stockoptionsystem.com@gmail.com |
Traders' Resource Links | |
| StockOptionSystem.com has not added any product or service information to TRADERS' RESOURCE. | |
Click here for more information about our publications!
Comments
Date:�11/27/13Rank:�4Comment:�

Request Information From Our Sponsors
- StockCharts.com, Inc.
- Candle Patterns
- Candlestick Charting Explained
- Intermarket Technical Analysis
- John Murphy on Chart Analysis
- John Murphy's Chart Pattern Recognition
- John Murphy's Market Message
- MurphyExplainsMarketAnalysis-Intermarket Analysis
- MurphyExplainsMarketAnalysis-Visual Analysis
- StockCharts.com
- Technical Analysis of the Financial Markets
- The Visual Investor
- VectorVest, Inc.
- Executive Premier Workshop
- One-Day Options Course
- OptionsPro
- Retirement Income Workshop
- Sure-Fire Trading Systems (VectorVest, Inc.)
- Trading as a Business Workshop
- VectorVest 7 EOD
- VectorVest 7 RealTime/IntraDay
- VectorVest AutoTester
- VectorVest Educational Services
- VectorVest OnLine
- VectorVest Options Analyzer
- VectorVest ProGraphics v6.0
- VectorVest ProTrader 7
- VectorVest RealTime Derby Tool
- VectorVest Simulator
- VectorVest Variator
- VectorVest Watchdog