

HOT TOPICS LIST
- MACD
- Fibonacci
- RSI
- Gann
- ADXR
- Stochastics
- Volume
- Triangles
- Futures
- Cycles
- Volatility
- ZIGZAG
- MESA
- Retracement
- Aroon
INDICATORS LIST
LIST OF TOPICS
PRINT THIS ARTICLE
by Donald W. Pendergast, Jr.
Shares of Halliburton rose by 120% between June 2012 and early November 2013 but are now correcting back to test support levels.
Position: N/A
Donald W. Pendergast, Jr.
Freelance financial markets writer and online publisher of the Trendzetterz.com S&P 500 Weekly Forecast service.
PRINT THIS ARTICLE
REVERSAL
HAL: Post-High Correction Underway
11/26/13 04:19:51 PMby Donald W. Pendergast, Jr.
Shares of Halliburton rose by 120% between June 2012 and early November 2013 but are now correcting back to test support levels.
Position: N/A
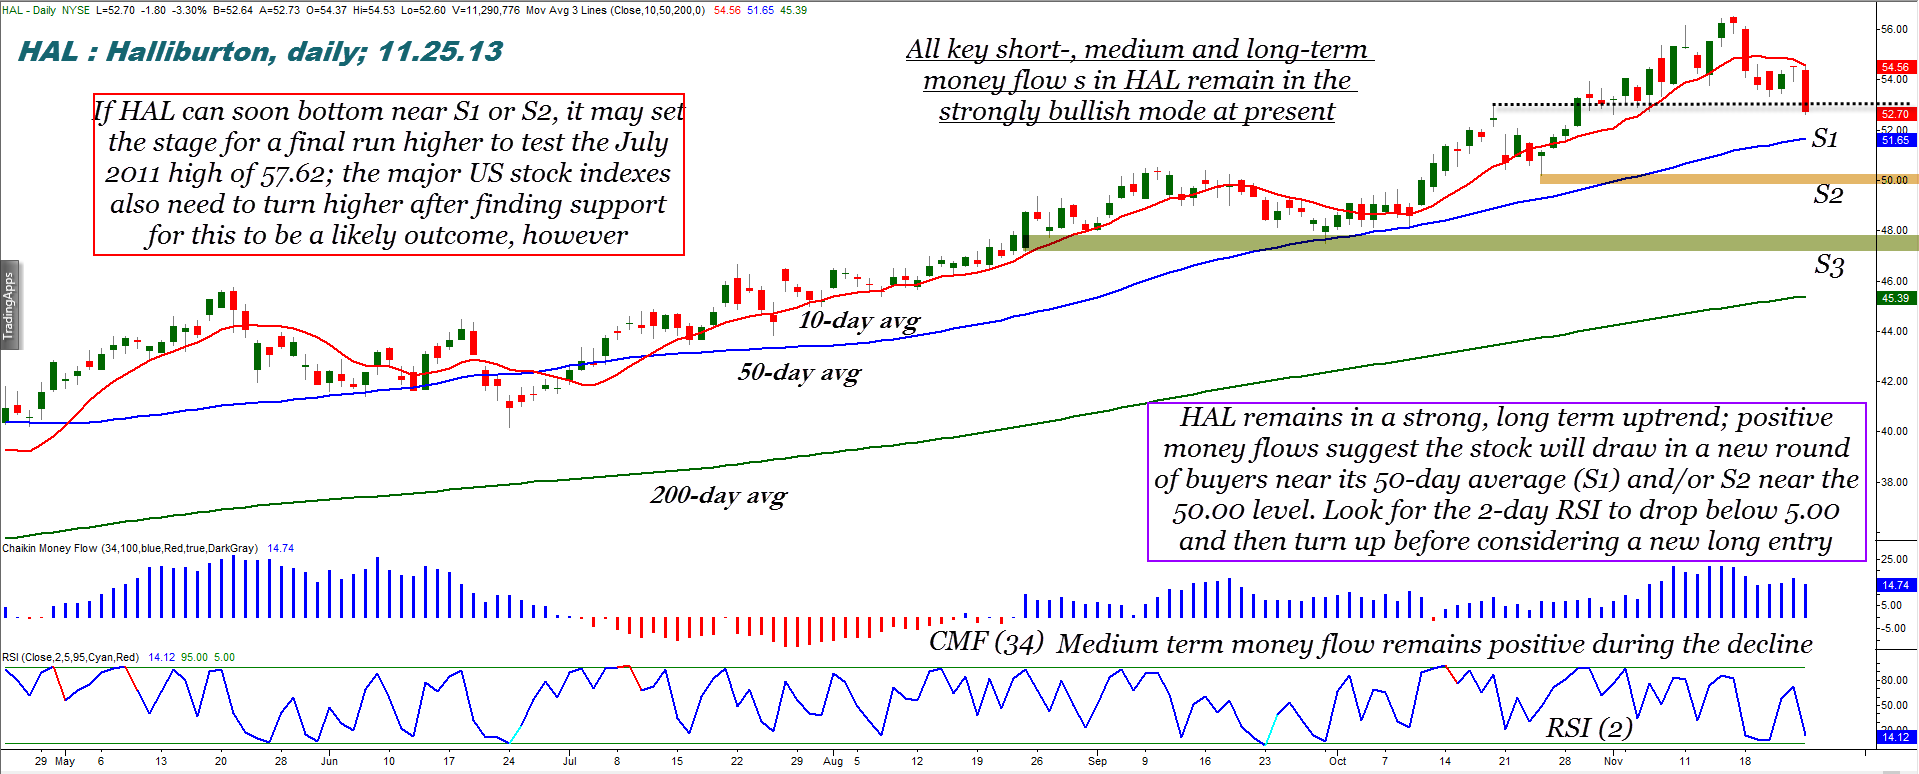
| Halliburton Company (HAL) is a great large-cap proxy stock for the entire oil services industry group, and when it starts to rally or decline, it's a safe bet that the entire group will follow this key energy sector bellwether issue. HAL enjoyed a terrific, sustained period of steady gains over the past 17 months — 120%, or nearly 7% per month, on average — but its current decline is suggesting one of two things: A. A major, multiyear high price is now in place, one that may stand unchallenged for a long time B. The stock simply needs to bleed off some of its speculative excess before mounting a new assault on its July 2011 all-time high of 57.62. Here's a look at HAL's daily chart, one that may offer several useful clues about the next big move in store for this stock. |
|
| Figure 1. Halliburton's (HAL) current correction appears to be more of a proportional bleed-off in the midst of an ongoing bull market rather than a major, bearish trend reversal. |
| Graphic provided by: TradeStation. |
| |
| From the depths of its June 2011 major multicycle low, HAL managed to run all the way from 26.28 to 56.52 in 17 months; the stock, although now down a bit from its early November 2013 highs, is still in a long term uptrend, trading well above its 50- and 200-day moving averages, both of which are sloping ever higher. As the Dow 30 index (.DJIA, DIA @YM) keeps setting new highs, the ratio of new 52-week highs to new 52-week lows among NYSE stocks is beginning to sharply diverge from the Dow 30, and HAL is one of those stocks that has begun turning down before the Dow finally calls this current, massive rally from November 2012 quits. But a downturn doesn't necessarily mean a bear market, at least in HAL's case, as the stock's 21-, 34-, 55-, 89-, 144-, 233- and 377-day Chaikin Money flow histograms are all trading well above their respective zero lines (the 34-day variant is depicted on the chart). Given the up-sloping major trend lines already in place, this is a high probability confirmation that the "smart money" interests in HAL are likely to step back in as buyers again, once the stock tests either of the top two identified support zones on HAL's daily chart: 1.Support S1 is the all-important 50-day moving average (blue line) and is currently near 51.65. Given the incredibly bullish money flow trends, this is a high-probability level in which to expect a minor tradable bounce and would be a great place to take profits if currently short HAL. 2. Support S2 coincides with previous cycle low zones from early October 2013 and is near 47.75; should the decline stretch beneath S1, this is also a high probability zone in which to see the bulls reestablish new long positions. Unless the previous high flier stock's money flows and earnings growth potential turn negative during a proportional correction, there is no reason to doubt that buyers will reemerge to pick up shares of HAL at what they believe are bargain prices, hoping to catch the next wave higher in the stock. |
|
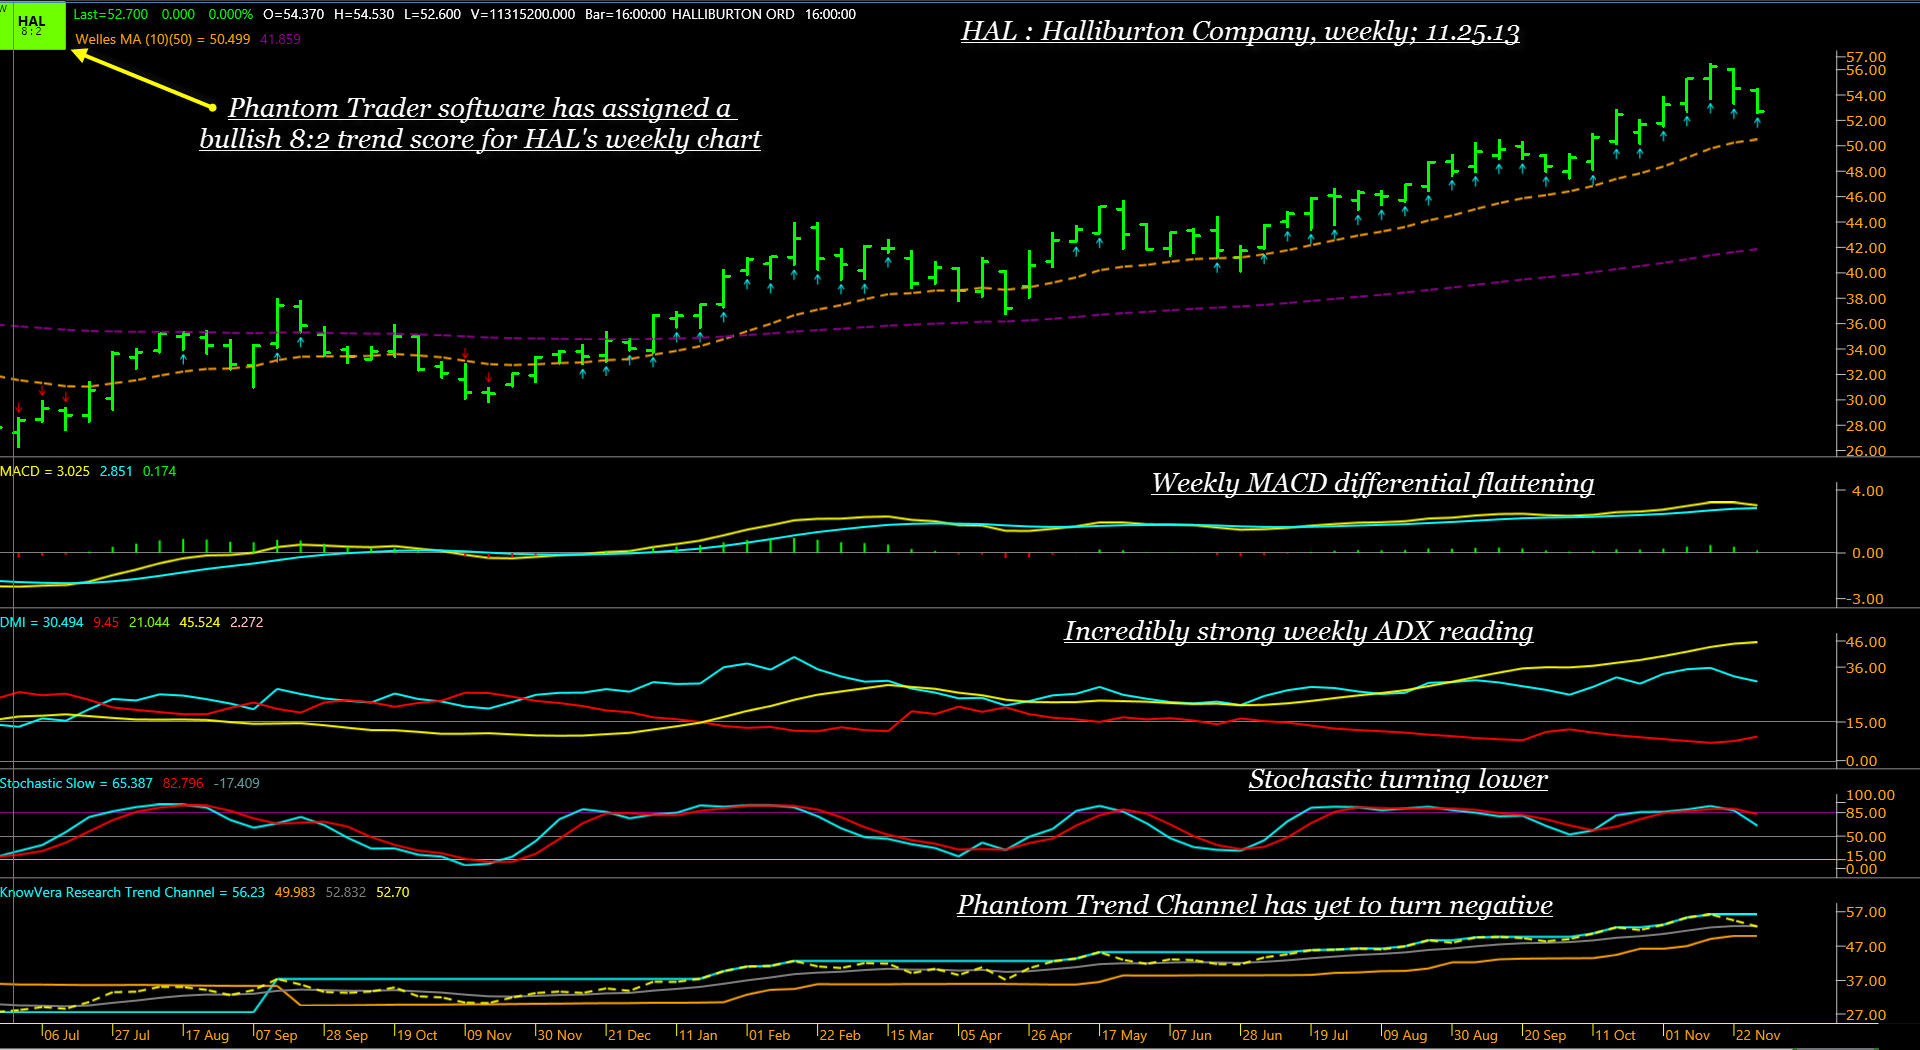
| Figure 2. Note the wide separation of the 10- and 50-week averages on HAL's weekly chart; the ADX reading is also extremely bullish, but the stochastic and MACD are already confirming that a pullback is in process. |
| Graphic provided by: Phantom Trader by KnowVera LLC. |
| |
| One of the key indicators to watch here is the 2-day RSI; should it bottom out at a reading of 5.00 or below as HAL hits S1 or S2, look to see if the stock begins to turn higher; a new short term long swing entry can be attempted as the high of the bar making the RSI low is finally exceeded; a 2-bar trailing stop of the daily lows can be used to manage the trade and an initial stop should be placed a modest number of ticks beneath the appropriate support level. Not every stock will be a 'buy' during the impending correction in the Dow 30 and S&P 500 index (.SPX, SPY, @ES) but for those who are bullish on HAL's potential for more gains as 2014 approaches, they may yet be offered an attractive, low risk chance to ride the stock higher. Be sure to keep your account risk at no more than 1% on this potential long swing trade setup. Trade wisely until we meet here again. |
Freelance financial markets writer and online publisher of the Trendzetterz.com S&P 500 Weekly Forecast service.
| Title: | Market consultant and writer |
| Company: | Trendzetterz |
| Address: | 81 Hickory Hollow Drive |
| Crossville, TN 38555 | |
| Phone # for sales: | 904-303-4814 |
| Website: | trendzetterz.com |
| E-mail address: | support@trendzetterz.com |
Traders' Resource Links | |
| Trendzetterz has not added any product or service information to TRADERS' RESOURCE. | |
Click here for more information about our publications!
PRINT THIS ARTICLE

Request Information From Our Sponsors
- StockCharts.com, Inc.
- Candle Patterns
- Candlestick Charting Explained
- Intermarket Technical Analysis
- John Murphy on Chart Analysis
- John Murphy's Chart Pattern Recognition
- John Murphy's Market Message
- MurphyExplainsMarketAnalysis-Intermarket Analysis
- MurphyExplainsMarketAnalysis-Visual Analysis
- StockCharts.com
- Technical Analysis of the Financial Markets
- The Visual Investor
- VectorVest, Inc.
- Executive Premier Workshop
- One-Day Options Course
- OptionsPro
- Retirement Income Workshop
- Sure-Fire Trading Systems (VectorVest, Inc.)
- Trading as a Business Workshop
- VectorVest 7 EOD
- VectorVest 7 RealTime/IntraDay
- VectorVest AutoTester
- VectorVest Educational Services
- VectorVest OnLine
- VectorVest Options Analyzer
- VectorVest ProGraphics v6.0
- VectorVest ProTrader 7
- VectorVest RealTime Derby Tool
- VectorVest Simulator
- VectorVest Variator
- VectorVest Watchdog