HOT TOPICS LIST
- MACD
- Fibonacci
- RSI
- Gann
- ADXR
- Stochastics
- Volume
- Triangles
- Futures
- Cycles
- Volatility
- ZIGZAG
- MESA
- Retracement
- Aroon
INDICATORS LIST
LIST OF TOPICS
PRINT THIS ARTICLE
by Koos van der Merwe
The Iranian nuclear threat seems to be fading.
Position: Hold
Koos van der Merwe
Has been a technical analyst since 1969, and has worked as a futures and options trader with First Financial Futures in Johannesburg, South Africa.
PRINT THIS ARTICLE
GANN
So, Is It Time To Start Buying Gold?
11/26/13 03:57:25 PMby Koos van der Merwe
The Iranian nuclear threat seems to be fading.
Position: Hold
| We all know that in times of economic uncertainty, money looks for a safe haven in gold. With the Iranian nuclear threat slowly vanishing; with President Barak Obama stating that he will slowly start lifting sanctions against Iran, one wonders what the future of the gold price has in store? The Prime Minister of Israel, Benjamin Netanyahu however, is still cautious, not quite believing that Iran will totally give up its nuclear ambitions. But then, "being safe rather than being sorry", for him, is the way to go. Caution does prevail. So how does this affect the London Gold price? Of course it should cause the price to weaken even further, however when one looks at the charts, there is a large 'but' building. |

|
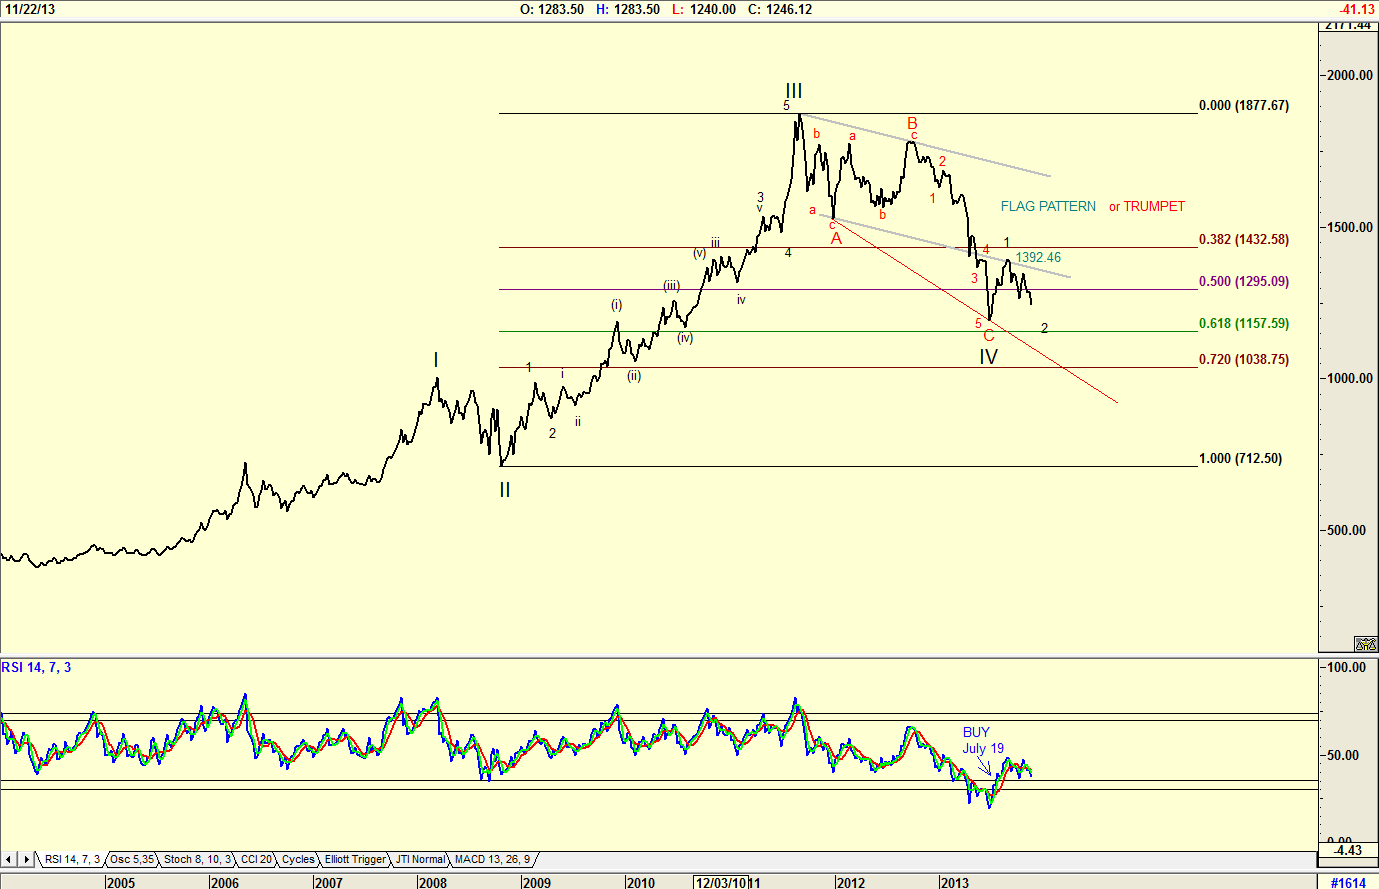
| Figure 1. Weekly chart of London Gold with Elliott Wave count and pattern uncertainty. |
| Graphic provided by: AdvancedGET. |
| |
| My chart in Figure 1 is a weekly chart of the London Gold price. The chart is suggesting that the gold price has completed a WAVE IV and is now tracing a Wave 2 of WAVE V. A wave 2 can be a 100% retracement of wave 1, which does mean that the price could fall further. Note how Wave 1 of WAVE V rose to test the trend line drawn parallel to the upper trend line drawn from 'A'. This does suggest that the gold price could find a strong resistance should it rise to retest this trend line. The Flag pattern suggested by the two trend lines obviously failed. Drawing a line from 'A' to 'IV' does suggest that a Trumpet pattern has formed. A Trumpet pattern suggests uncertainty, and let's face it, at the moment there is a great deal of uncertainty about the gold price. The RSI indicator is suggesting a positive move having given a buy signal on July 19th, however one should be prepared for a possible divergence buy signal, ie where the price forms a new low while the RSI gives a higher low. |

|
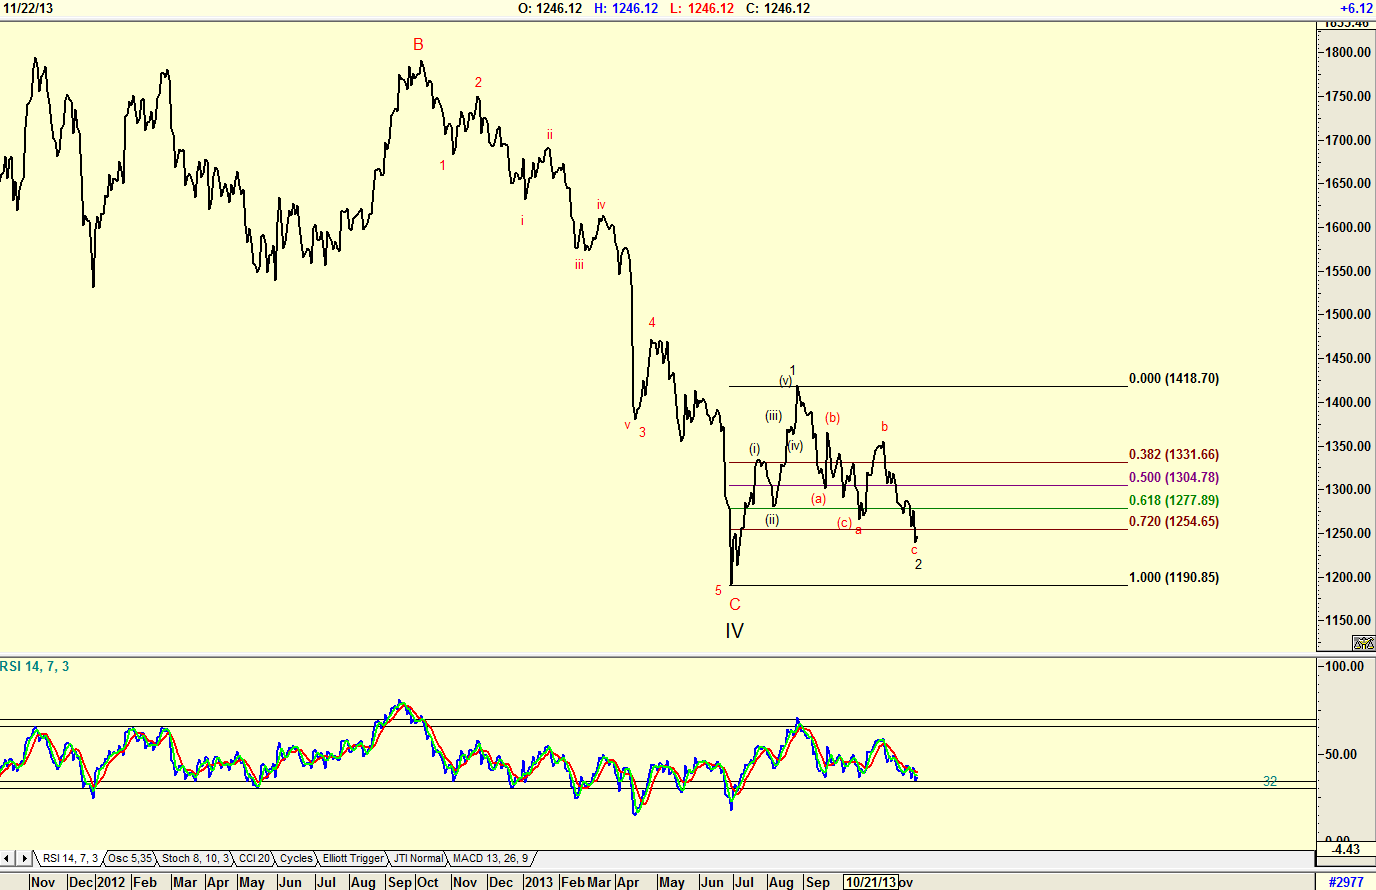
| Figure 2. Daily chart of London Gold price with Elliott Wave count. |
| Graphic provided by: AdvancedGET. |
| |
| The chart in Figure 2 is a daily chart of the London Gold price, and shows that the Wave 2 of WAVE V correction could fall further. The daily RSI indicator has not fallen below the 32 level, suggesting that the price could still fall further. Note how the price has already fallen past the 72% retracement level, suggesting that it could fall to 1190.85, the 100% retracement. The first rule of Elliott Wave theory is that "the wave count must look correct." Should the price fall below $1190.85, the wave count will not change because that would make it look incorrect. Of course, one should never forget that an Elliott Wave count is not cast in stone. An Elliott Wave count is simply a signpost in the wilderness, and can change with the next signpost a little way down the road. |

|
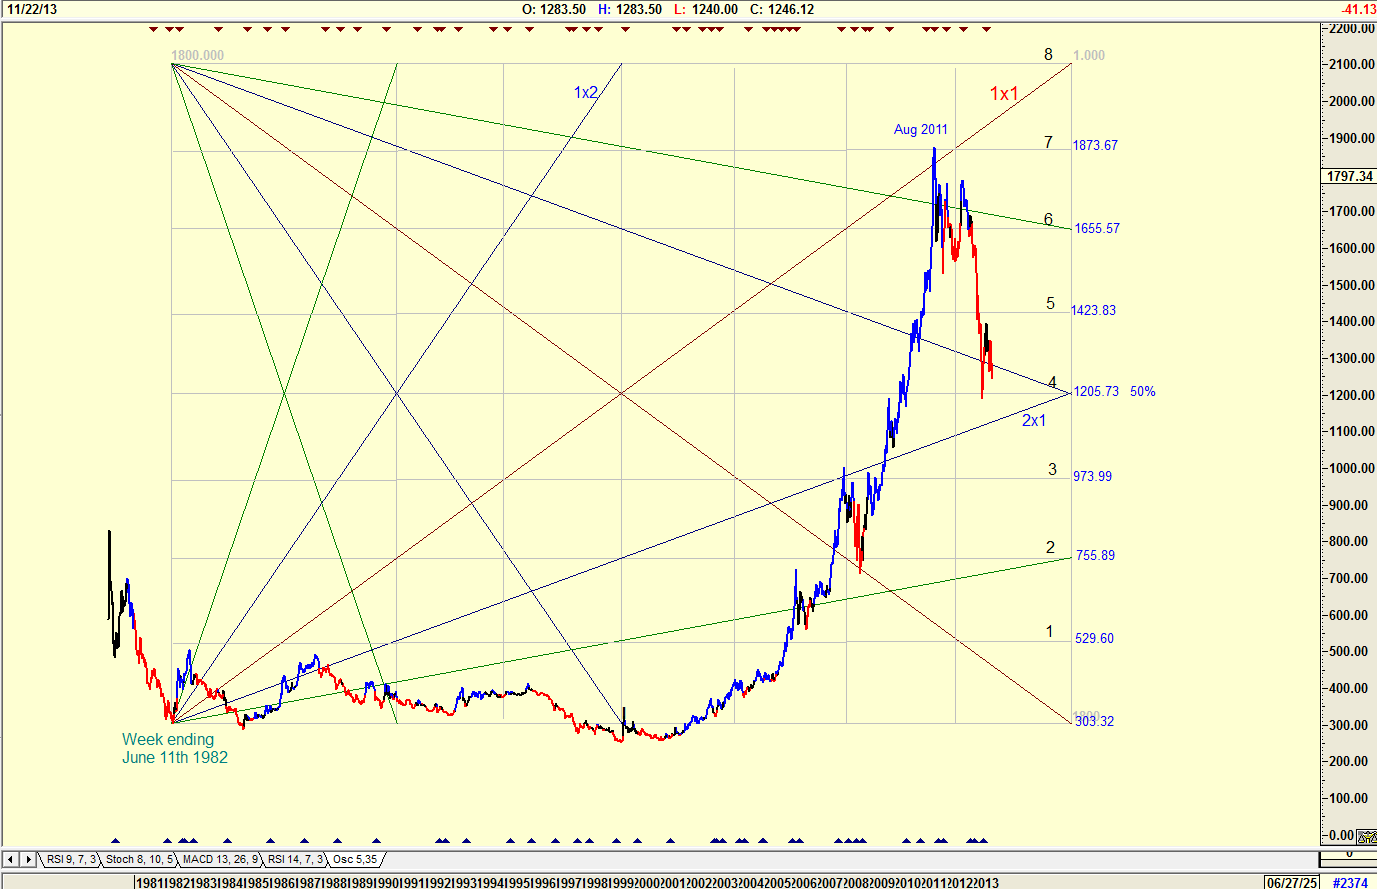
| Figure 3. Gann Square of the London Gold price. |
| Graphic provided by: AdvancedGET. |
| |
| The chart in Figure 3 is a weekly chart with a GANN square overlaid. Note how the price, rising from a low on June 11th 1982, had a 1x1 Gann line that found the high in August 2011 on line 7 of the Gann square. Note how the price fell and found support on line 4, the 50% level. This does suggest that the Elliott Wave count shown in Figures 1 and 2 could be correct. With the Nuclear threat of Iran fading and with Benjamin Netanyahu's cynicism as to Iran's honesty, one wonders whether Netanyahu will be correct, causing the coming rise of the London Gold price. Of course, when the rise does occur, and it will, it may be a long time in coming. Nevertheless, the fact that the charts are suggesting the price will rise sometime in the future is disturbing, because it suggests world uncertainty. So, would I buy gold shares at the moment? Not yet, but I am preparing a list of shares and ETF's I would like to own once the gold price starts rising. |
Has been a technical analyst since 1969, and has worked as a futures and options trader with First Financial Futures in Johannesburg, South Africa.
| Address: | 3256 West 24th Ave |
| Vancouver, BC | |
| Phone # for sales: | 6042634214 |
| E-mail address: | petroosp@gmail.com |
Click here for more information about our publications!
Comments
Date: 11/30/13Rank: 4Comment:

Request Information From Our Sponsors
- VectorVest, Inc.
- Executive Premier Workshop
- One-Day Options Course
- OptionsPro
- Retirement Income Workshop
- Sure-Fire Trading Systems (VectorVest, Inc.)
- Trading as a Business Workshop
- VectorVest 7 EOD
- VectorVest 7 RealTime/IntraDay
- VectorVest AutoTester
- VectorVest Educational Services
- VectorVest OnLine
- VectorVest Options Analyzer
- VectorVest ProGraphics v6.0
- VectorVest ProTrader 7
- VectorVest RealTime Derby Tool
- VectorVest Simulator
- VectorVest Variator
- VectorVest Watchdog
- StockCharts.com, Inc.
- Candle Patterns
- Candlestick Charting Explained
- Intermarket Technical Analysis
- John Murphy on Chart Analysis
- John Murphy's Chart Pattern Recognition
- John Murphy's Market Message
- MurphyExplainsMarketAnalysis-Intermarket Analysis
- MurphyExplainsMarketAnalysis-Visual Analysis
- StockCharts.com
- Technical Analysis of the Financial Markets
- The Visual Investor
