HOT TOPICS LIST
- MACD
- Fibonacci
- RSI
- Gann
- ADXR
- Stochastics
- Volume
- Triangles
- Futures
- Cycles
- Volatility
- ZIGZAG
- MESA
- Retracement
- Aroon
INDICATORS LIST
LIST OF TOPICS
PRINT THIS ARTICLE
by Billy Williams
A price move in Arris Enterprises, Inc. (ARRS) has been a decade in the making and is now taking off, so don't get left behind.
Position: Buy
Billy Williams
Billy Williams has been trading the markets for 27 years, specializing in momentum trading with stocks and options.
PRINT THIS ARTICLE
TECHNICAL ANALYSIS
ARRS Monthly Squeeze Play
11/26/13 03:33:33 PMby Billy Williams
A price move in Arris Enterprises, Inc. (ARRS) has been a decade in the making and is now taking off, so don't get left behind.
Position: Buy
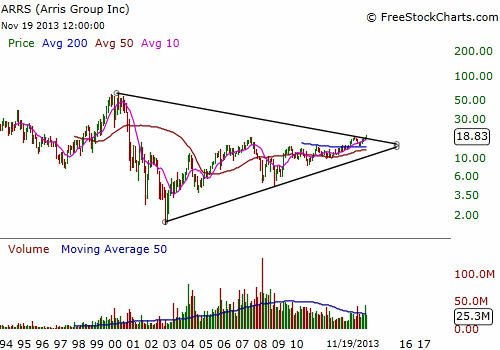
| Arris Enterprises, Inc. (ARRS), a developer and manufacturer of data, telephone, and video equipment. ARRS is a one of the leaders of the Telecom-Cable and Satellite Industry Group which is made up of 31 stocks. AARS has sported an impressive year-over-year quarterly earnings release of 198% which has caused the price action to firm up and move higher. But, fundamentals don't necessarily lead to major price moves. Accumulation, however, often does which is why ARRS' price chart tells us that something big is underway. The stock has had lackluster technical action over the last few years where price has experienced wild swings, but if you take a bird's eye view of ARRS' price chart you can see that it looks like the bulls are gathering strength to push the stock higher. |

|
| Figure 1. ARRS topped out during the "Dotcom Era" and subsequently crashed. It has been climbing its way back for almost 10 years, developing a triangle pattern to act as its first stage base pattern to launch its price into higher territory. |
| Graphic provided by: www.freestockcharts.com. |
| |
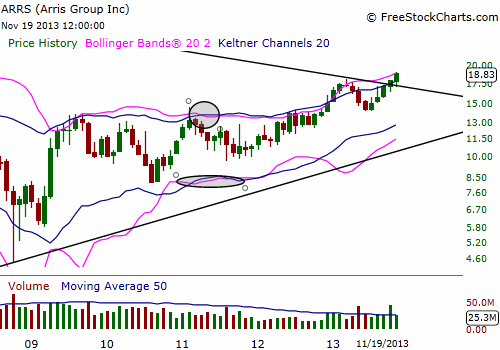
| If a stock could be named for a movie, then ARRS would be named "True Grit". The stock imploded back in the "Dotcom Crash" in early 1999 and began the hard climb back to positive territory after hitting its bottom in late 2002 The stock was then off the radar for years until something interesting began to develop. In 2007 to 2009, on the monthly price chart, ARRS began to develop a triangle pattern that was beginning to set a first stage base pattern, as well as experience a rise in volume, or accumulation. Institutional traders were revealing their hand when the 50-day average volume began to rise and peaked in late 2009 before drying up. Volume began to decline but the stock held firm, and then something more significant appeared. Squeeze setups occur when a stock's Bollinger Bands trade within its Keltner Channels. It signifies the volatility is contracting within the stock's average price range and since volatility reverts to its mean, the stock should explode out of this pattern and into a strong price move. Squeeze patterns occur on a variety of time periods but when they occur on a large time frame — like a monthly chart — the price move can last for years when it triggers. |

|
| Figure 2. In mid-2011, a Squeeze setup developed and fired off which could mean that the stock is entering a bull run that could last for years. |
| Graphic provided by: www.freestockcharts.com. |
| |
| Between May and September of 2011, a monthly squeeze setup developed and the stage was set for a price move that could erupt from within a developing triangle pattern which was also a first stage base pattern for ARRS. The combination of these factors working together meant that a big move was underway for ARRS and that it could potentially last for years. Acting on this information, ARRS offered several low-risk buying opportunities along the way with the most significant on October 31, 2013, when ARRS broke above the upper trendline of the monthly triangle pattern on volume that was 600% its normal 50-day average. |

|
| Figure 3. ARRS offered several long entries after the monthly squeeze setup was triggered including a daily price squeeze setup just before the stock broke through the upper trendline of the long-term triangle pattern on October 31, 2013. |
| Graphic provided by: www.freestockcharts.com. |
| |
| The stock had a low-volume pullback shortly after the breakout move which was a second buying opportunity, and then went on to climb higher. Even if you missed the initial move and the pullback, this stock should be in play for years as volatility begins to rise and accumulation continues. Look for pullbacks and/or a second stage base pattern where price should really take off. And, always, after taking a position in any stock, be sure to set your stop loss point no more than 7% from your entry price. |
Billy Williams has been trading the markets for 27 years, specializing in momentum trading with stocks and options.
| Company: | StockOptionSystem.com |
| E-mail address: | stockoptionsystem.com@gmail.com |
Traders' Resource Links | |
| StockOptionSystem.com has not added any product or service information to TRADERS' RESOURCE. | |
Click here for more information about our publications!
PRINT THIS ARTICLE

Request Information From Our Sponsors
- VectorVest, Inc.
- Executive Premier Workshop
- One-Day Options Course
- OptionsPro
- Retirement Income Workshop
- Sure-Fire Trading Systems (VectorVest, Inc.)
- Trading as a Business Workshop
- VectorVest 7 EOD
- VectorVest 7 RealTime/IntraDay
- VectorVest AutoTester
- VectorVest Educational Services
- VectorVest OnLine
- VectorVest Options Analyzer
- VectorVest ProGraphics v6.0
- VectorVest ProTrader 7
- VectorVest RealTime Derby Tool
- VectorVest Simulator
- VectorVest Variator
- VectorVest Watchdog
- StockCharts.com, Inc.
- Candle Patterns
- Candlestick Charting Explained
- Intermarket Technical Analysis
- John Murphy on Chart Analysis
- John Murphy's Chart Pattern Recognition
- John Murphy's Market Message
- MurphyExplainsMarketAnalysis-Intermarket Analysis
- MurphyExplainsMarketAnalysis-Visual Analysis
- StockCharts.com
- Technical Analysis of the Financial Markets
- The Visual Investor
