HOT TOPICS LIST
- MACD
- Fibonacci
- RSI
- Gann
- ADXR
- Stochastics
- Volume
- Triangles
- Futures
- Cycles
- Volatility
- ZIGZAG
- MESA
- Retracement
- Aroon
INDICATORS LIST
LIST OF TOPICS
PRINT THIS ARTICLE
by Matt Blackman
In the last year, CSIQ jumped more than 4000%. To paraphrase the great Winston Churchill, is this the end, the beginning of the end or the end of the beginning for this solar powerhouse?
Position: N/A
Matt Blackman
Matt Blackman is a full-time technical and financial writer and trader. He produces corporate and financial newsletters, and assists clients in getting published in the mainstream media. He is the host of TradeSystemGuru.com. Matt has earned the Chartered Market Technician (CMT) designation. Find out what stocks and futures Matt is watching on Twitter at www.twitter.com/RatioTrade
PRINT THIS ARTICLE
TREND-CHANNEL
Canadian Solar Energy Is On the Move
11/22/13 11:07:19 AMby Matt Blackman
In the last year, CSIQ jumped more than 4000%. To paraphrase the great Winston Churchill, is this the end, the beginning of the end or the end of the beginning for this solar powerhouse?
Position: N/A
| Catching a 2 or 3 bagger to double or triple your money is exciting enough in the trading business. Catching a 40-bagger is a rare thrill indeed, but it is the reward that the fortunate trader who bought and held Canadian Solar Energy (CSIQ) between November 2012 and November 2013 would have enjoyed. So has this stock got more room to run or is it due for a correction? |

|
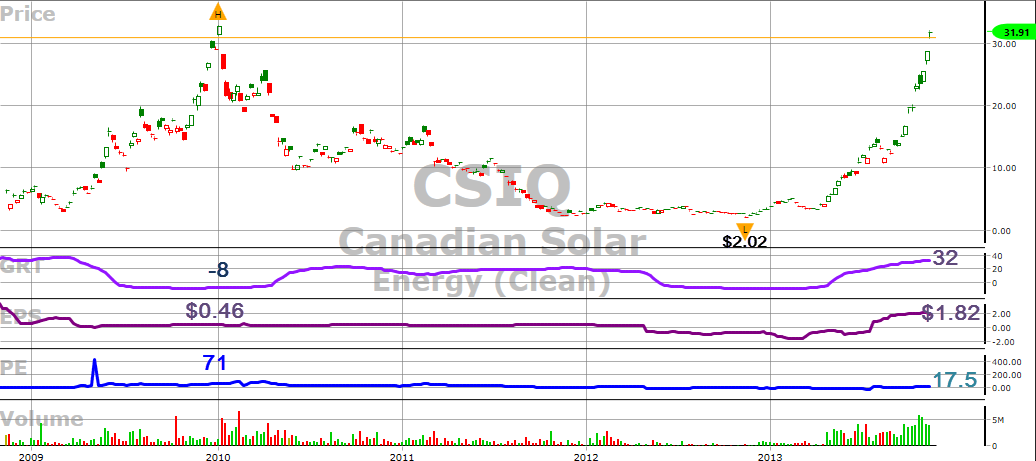
| Figure 1 – Weekly chart of Canadian Solar Energy (CSIQ) showing highs and lows in the last 5 years together with the forecasted Growth Rate (GRT), forecasted annual Earnings per Share (EPS) and the Price/Earnings Ratio (PE). |
| Graphic provided by: www.VectorVest.com. |
| |
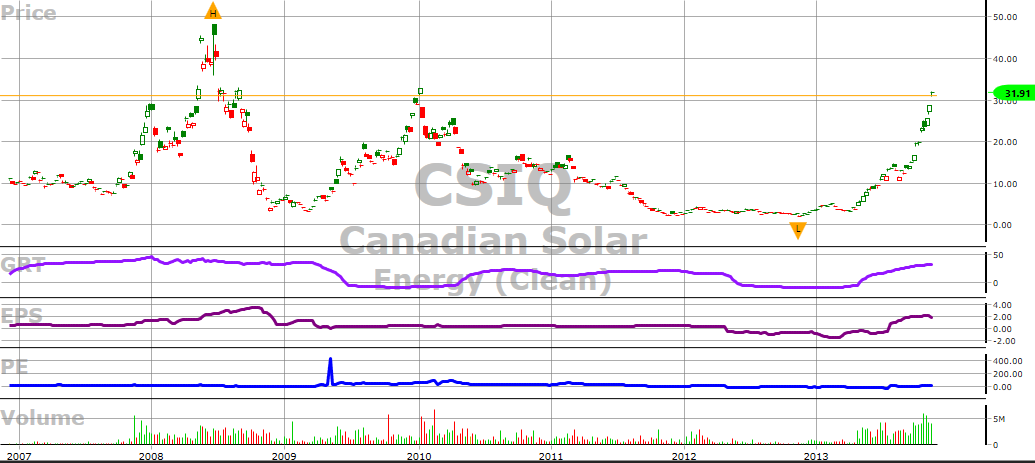
| As we learned with companies like Tesla, which also experienced a strong parabolic move between November 2012 and October 2013 only to see the stock drop more than 35% in November, there are limits to how high a stock can rise before it needs a rest. One difference between the two stocks is that CSIQ has seen much higher levels before when it traded north of $48 in June 2008. Another is the fact that CSIQ earned $0.56/share in the latest quarter while Telsa lost $0.32. Both companies have similar gross operating profit and gross margins per share but CSIQ wins hands down in the valuation department with a meager price-to-book of $3.92 versus Telsa's sky-high P/B of $26.32. And as we see in Figure 2, CSIQ forecasted EPS and growth rate (GRT) were about the same in late November 2013 as they were back in 2008 when the stock was trading at $48 — according to data from VectorVest.com (Figure 2). |

|
| Figure 2 – Weekly chart of CSIQ showing 7 years of data that includes the all-time high of $48.18 during the week of June 20, 2008. |
| Graphic provided by: www.VectorVest.com. |
| |
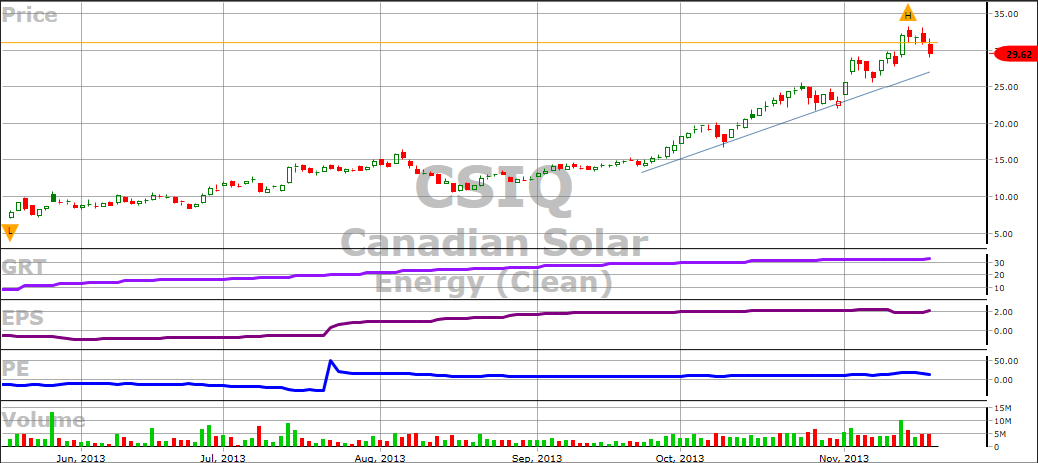
| But as any trader worth his or her salt knows, fundamentals really don't matter as much in the short term — it's the technicals that get you in and out of trades. As we see in Figure 3, CSIQ is in consolidation mode with long-term trendline support around $27 (blue line) and short-term support at $29.25 (not shown). |

|
| Figure 3 – Daily CSIQ chart showing trendline support around $27.50 in late November 2013. |
| Graphic provided by: www.VectorVest.com. |
| |
| Assuming this support holds, the market rally keeps going and solar stocks remain in the spotlight, CSIQ still may have a way to run before it is forced to take a Tesla-like breather. |
Matt Blackman is a full-time technical and financial writer and trader. He produces corporate and financial newsletters, and assists clients in getting published in the mainstream media. He is the host of TradeSystemGuru.com. Matt has earned the Chartered Market Technician (CMT) designation. Find out what stocks and futures Matt is watching on Twitter at www.twitter.com/RatioTrade
| Company: | TradeSystemGuru.com |
| Address: | Box 2589 |
| Garibaldi Highlands, BC Canada | |
| Phone # for sales: | 604-898-9069 |
| Fax: | 604-898-9069 |
| Website: | www.tradesystemguru.com |
| E-mail address: | indextradermb@gmail.com |
Traders' Resource Links | |
| TradeSystemGuru.com has not added any product or service information to TRADERS' RESOURCE. | |
Click here for more information about our publications!
PRINT THIS ARTICLE

Request Information From Our Sponsors
- StockCharts.com, Inc.
- Candle Patterns
- Candlestick Charting Explained
- Intermarket Technical Analysis
- John Murphy on Chart Analysis
- John Murphy's Chart Pattern Recognition
- John Murphy's Market Message
- MurphyExplainsMarketAnalysis-Intermarket Analysis
- MurphyExplainsMarketAnalysis-Visual Analysis
- StockCharts.com
- Technical Analysis of the Financial Markets
- The Visual Investor
- VectorVest, Inc.
- Executive Premier Workshop
- One-Day Options Course
- OptionsPro
- Retirement Income Workshop
- Sure-Fire Trading Systems (VectorVest, Inc.)
- Trading as a Business Workshop
- VectorVest 7 EOD
- VectorVest 7 RealTime/IntraDay
- VectorVest AutoTester
- VectorVest Educational Services
- VectorVest OnLine
- VectorVest Options Analyzer
- VectorVest ProGraphics v6.0
- VectorVest ProTrader 7
- VectorVest RealTime Derby Tool
- VectorVest Simulator
- VectorVest Variator
- VectorVest Watchdog
