

HOT TOPICS LIST
- MACD
- Fibonacci
- RSI
- Gann
- ADXR
- Stochastics
- Volume
- Triangles
- Futures
- Cycles
- Volatility
- ZIGZAG
- MESA
- Retracement
- Aroon
INDICATORS LIST
LIST OF TOPICS
PRINT THIS ARTICLE
by Donald W. Pendergast, Jr.
Despite returning worse than expected Q3 earnings, shares of JC Penney gap higher -- right into a key resistance zone.
Position: N/A
Donald W. Pendergast, Jr.
Freelance financial markets writer and online publisher of the Trendzetterz.com S&P 500 Weekly Forecast service.
PRINT THIS ARTICLE
SUPPORT & RESISTANCE
JC Penney: Bear Rally into Resistance
11/25/13 04:44:52 PMby Donald W. Pendergast, Jr.
Despite returning worse than expected Q3 earnings, shares of JC Penney gap higher -- right into a key resistance zone.
Position: N/A
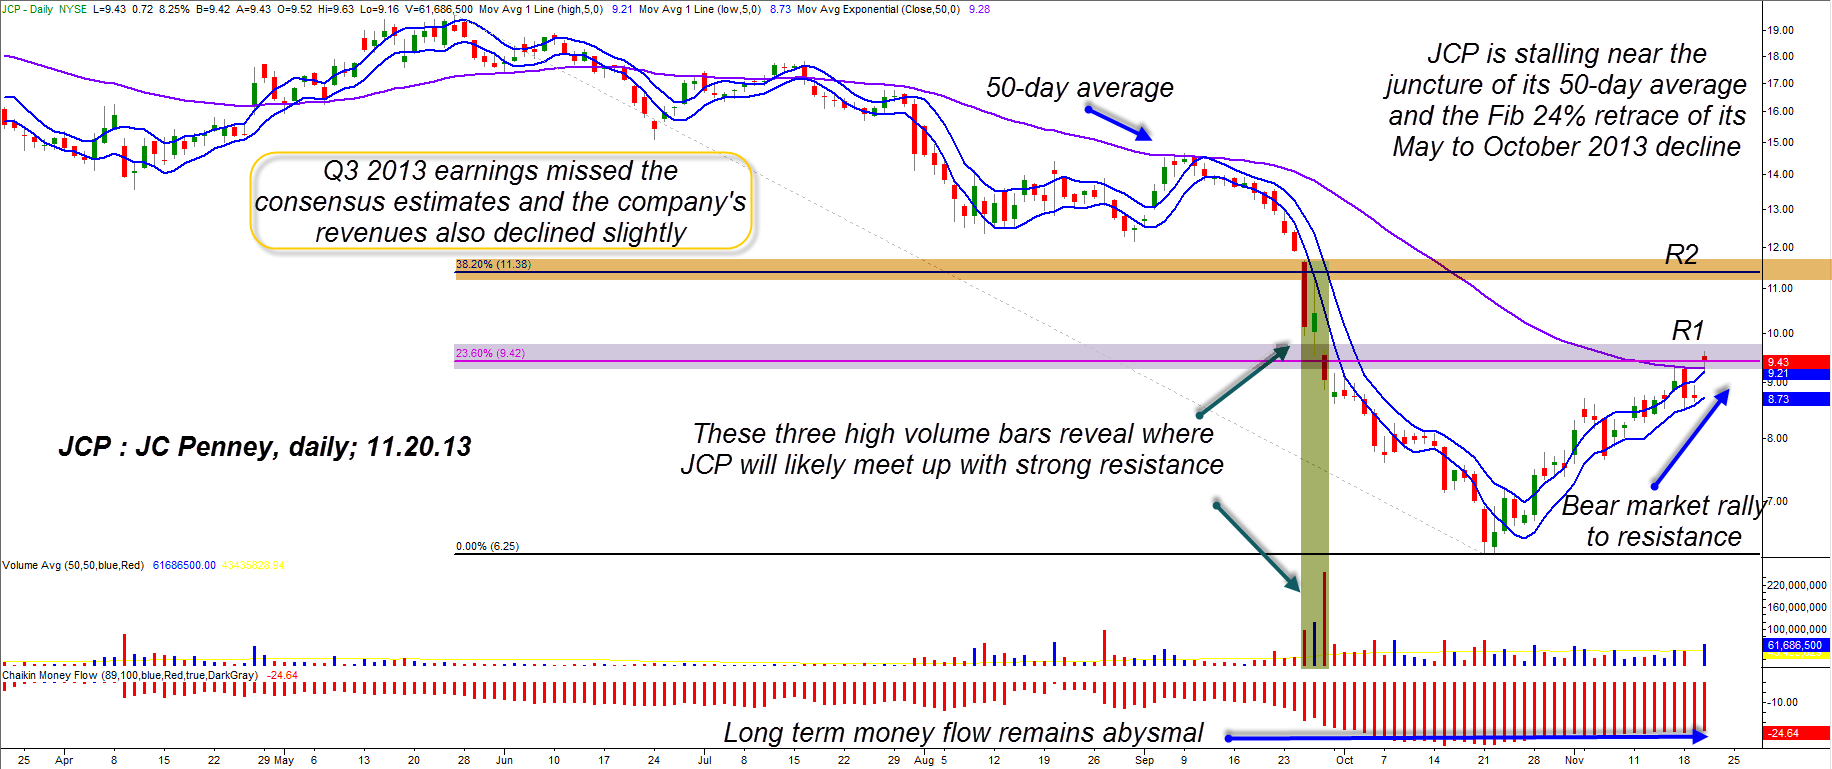
| Shares of retailer JC Penney (JCP) have been in a long term bear market since peaking at 87.18 in February 2007; the first wave of heavy selling ran until March 20019, with the stock beaten all the way down to 13.71; after a rally back to 43.18 in February 2012, the stock fell through the floor again, bottoming out at 6.24 in October 2013. From a technical and fundamental point of view, the situation for JCP looks more than grim, and the future of this once-innovative retailer appears to be very uncertain. Here's a look at JCP's recent bear market rally and an idea on how to play the stock should it start falling again soon. |
|
| Figure 1. With JC Penney shares (JCP) now reaching the junction of Fibonacci resistance and its 50-day moving average, expect this rally to stall and make another attempt to test the October 2012 lows. |
| Graphic provided by: TradeStation. |
| |
| When a stock goes into freefall — especially an S&P 500 index component — it must have truly horrific long term fundamental value issues — and JC Penney's common stock certainly has rotten fundies. Earnings were good in the 90s and up until the February 2007 high, but have generally disappointed or been downright horrible since then. In its most recent quarter (Q3 2013) the company lost $1.81 per share, which was even worse than the minus $1.78 consensus figure bandied about by Wall Street analysts. This super-bearish fundamental stat is clearly borne out via the 89-day Chaikin Money flow histogram (CMF)(89) at the bottom of JCP's daily chart. Even after such a vicious decline into last month's low, there was still no sign of a bullish price/money flow divergence, and that's what makes this current bear market rally in the stock look so fragile and vulnerable. That the long term money flow histogram remains mired down near the same level as it was at the October 2013 lows suggests that the "smart money" are not interested in taking large positions in JCP at this time. In fact, with the stock now near its downward-sloping 50-day average and the 24% Fibonacci retracement of the latest long term decline, this looks like a great place for savvy traders to consider going short again as this bear market rally in JCP is getting overextended. |
|
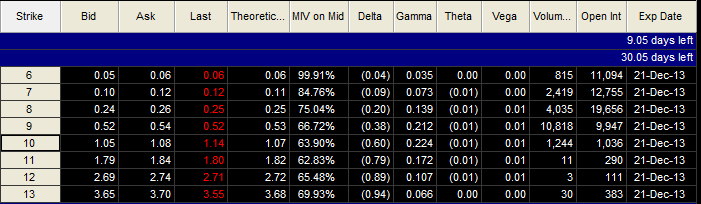
| Figure 2. The January '14 JCP $10.00 put option has a healthy open interest, the bid/ask spread is very close and daily time decay (theta) is small. |
| Graphic provided by: TradeStation. |
| Graphic provided by: TradeStation OptionStation. |
| |
| Playing JCP on the short side might go something like this: 1. On a decline below 9.12 consider buying the January '14 JCP $10.00 put option; this put has a large open interest figure, a very close bid-ask spread and a small daily time decay per contract/per day. 2. Support exists near 8.53 and 7.63; use these numbers to guide your profit-taking plan and try to be out of the entire position when/if the lower target is hit. 3. Limit your account risk to 1% maximum and don't let the option lose more than half of its value or go in the money (above 10.00) at any time. The major US stock indexes are close to a major decision point, but no one really knows if they are setting up again for a move to new all-time highs or if a noticeable correction has already commenced. JCP should fall rapidly if the S&P 500 (SPY) and Dow 30 (DIA) indexes take the latter route, with JCP selling off in sympathy, especially with such poor fundamentals and money flow trends in place. Trade wisely until we meet here again. |
Freelance financial markets writer and online publisher of the Trendzetterz.com S&P 500 Weekly Forecast service.
| Title: | Market consultant and writer |
| Company: | Trendzetterz |
| Address: | 81 Hickory Hollow Drive |
| Crossville, TN 38555 | |
| Phone # for sales: | 904-303-4814 |
| Website: | trendzetterz.com |
| E-mail address: | support@trendzetterz.com |
Traders' Resource Links | |
| Trendzetterz has not added any product or service information to TRADERS' RESOURCE. | |
Click here for more information about our publications!
PRINT THIS ARTICLE

Request Information From Our Sponsors
- StockCharts.com, Inc.
- Candle Patterns
- Candlestick Charting Explained
- Intermarket Technical Analysis
- John Murphy on Chart Analysis
- John Murphy's Chart Pattern Recognition
- John Murphy's Market Message
- MurphyExplainsMarketAnalysis-Intermarket Analysis
- MurphyExplainsMarketAnalysis-Visual Analysis
- StockCharts.com
- Technical Analysis of the Financial Markets
- The Visual Investor
- VectorVest, Inc.
- Executive Premier Workshop
- One-Day Options Course
- OptionsPro
- Retirement Income Workshop
- Sure-Fire Trading Systems (VectorVest, Inc.)
- Trading as a Business Workshop
- VectorVest 7 EOD
- VectorVest 7 RealTime/IntraDay
- VectorVest AutoTester
- VectorVest Educational Services
- VectorVest OnLine
- VectorVest Options Analyzer
- VectorVest ProGraphics v6.0
- VectorVest ProTrader 7
- VectorVest RealTime Derby Tool
- VectorVest Simulator
- VectorVest Variator
- VectorVest Watchdog