

HOT TOPICS LIST
- MACD
- Fibonacci
- RSI
- Gann
- ADXR
- Stochastics
- Volume
- Triangles
- Futures
- Cycles
- Volatility
- ZIGZAG
- MESA
- Retracement
- Aroon
INDICATORS LIST
LIST OF TOPICS
PRINT THIS ARTICLE
by Billy Williams
A hungry world craves solar power for energy and one company is helping meet that demand and trending higher as a result.
Position: Hold
Billy Williams
Billy Williams has been trading the markets for 27 years, specializing in momentum trading with stocks and options.
PRINT THIS ARTICLE
TECHNICAL ANALYSIS
Price Trends and Solar Potential
11/25/13 04:22:56 PMby Billy Williams
A hungry world craves solar power for energy and one company is helping meet that demand and trending higher as a result.
Position: Hold
| While oil has temporarily pulled back and the price of gas has fallen, the energy markets still remain solidly under the bulls' control and are likely to remain that way for some time to come. At the same time, many entrepreneurs are scrambling to find alternative sources of energy to market to a hungry global consumer base — with solar energy at the top of the list. The promise of clean and unlimited energy has been the dream that has always existed just beyond the reach of both energy companies and a segment of society concerned about the negative impact of fossil fuels on the environment. While the jury is still out on current efforts to bring this energy source to market, as traders, the price action in this industry looks attractive for a number of reasons. In recent days, the Energy-Solar group has been the top performing group in the stock market, leading all other industries, sectors, and sub-sectors in both strength and performance. Investor sentiment is high for this industry as it holds both the inherent promise of a new technology that has the potential to create sweeping change across the globe along with a windfall of profits if successful. But, for you, the important thing is the compelling technicals that the industry presents for traders and, more importantly, the trends that are underway. |
|
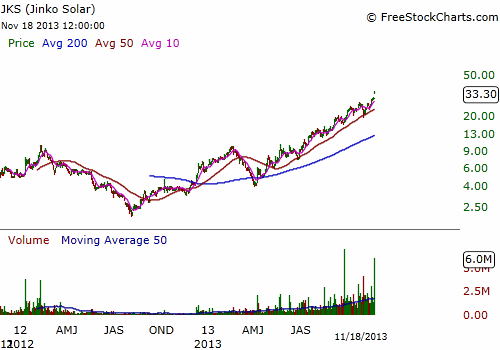
| Figure 1. JKS suffered a series of steep declines but has managed to climb its way back to higher ground and formed a strong bullish trend along the way. |
| Graphic provided by: www.freestockcharts.com. |
| |
| One stock, Jinko Solar (JKS), suffered a steep decline in early 2012 over fears and accusations as to whether its solar panels were cost-effective or even able to work. The news swept across Wall Street and investors ran from the stock as if they were caught in a burning building, which caused the stock to decline to an all-time low of $2.05. Worse, trade volume for the stock dried up to a 50-day daily average of just under 80,000 shares a day. But most high-performing stocks begin their big rally after a significant price low is hit, which was the case with JKS. Now, this still wasn't time to trade JKS because the stock still had poor technical criteria, and even after managing to trade higher went on to suffer another steep decline. But when the stock didn't trade below the $2.05 price low and started forming a series of higher price highs and higher price lows, that is the point where the stock warranted your attention. |
|
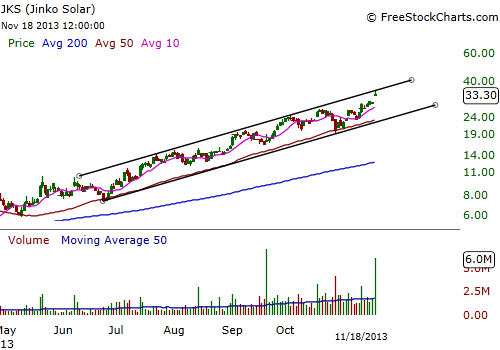
| Figure 2. JKS formed an upward price channel and presented a number of low-risk entries as price continued to trade higher. |
| Graphic provided by: www.freestockcharts.com. |
| |
| As JKS approached its $10 level there were two important criteria to be met for the stock to be considered a strong trade candidate. One, was the stock trading near its previous price high and, was it tightening up in its price action? Yes, on both counts. On May 21, 2013, JKS touched its former price high before the decline and went on to trade within a tight trading range and consolidated for the next 6 to 7 weeks. Two, was the stock's trade volume rising? Again, the answer is yes. JKS had a 50-day daily trade volume of around 80,000 at its price low which went up to around 580,000 during this period where it flirted with the $10 price level and was consolidating its price action near that price point. |
|
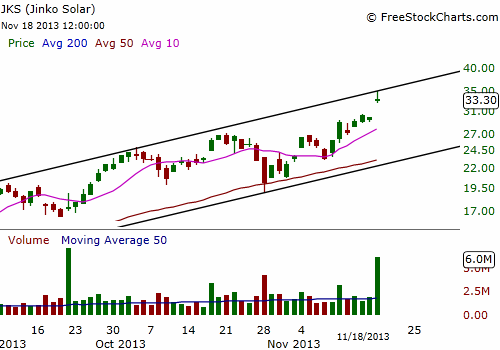
| Figure 3. JKS has been under steady accumulation by institutional traders for the last year which began with a 50-day daily volume average of 80k shares to almost 580k currently. Price recently gapped up higher on a volume spike of 6 million shares which has the stock trading at an all-time price high as well as near the upper end of its price channel. The stock will either breakout of the channel or pullback. In either case, a new buying opportunity may be in the making. |
| Graphic provided by: www.freestockcharts.com. |
| |
| Later, JKS formed a bullish price channel and has traded in a stair-step fashion from July of 2013 to present. Price has spiked higher on positive earnings reports and 50-day average daily volume has swelled to 1.8 million shares. JKS is obviously under heavy accumulation but now is not the time to take a position. Wait until price pulls back to the bottom of its price channel, or another entry signal is triggered like a pocket pivot. Then, enter using a stop loss of no more than 7% from your entry price. |
Billy Williams has been trading the markets for 27 years, specializing in momentum trading with stocks and options.
| Company: | StockOptionSystem.com |
| E-mail address: | stockoptionsystem.com@gmail.com |
Traders' Resource Links | |
| StockOptionSystem.com has not added any product or service information to TRADERS' RESOURCE. | |
Click here for more information about our publications!
PRINT THIS ARTICLE

Request Information From Our Sponsors
- StockCharts.com, Inc.
- Candle Patterns
- Candlestick Charting Explained
- Intermarket Technical Analysis
- John Murphy on Chart Analysis
- John Murphy's Chart Pattern Recognition
- John Murphy's Market Message
- MurphyExplainsMarketAnalysis-Intermarket Analysis
- MurphyExplainsMarketAnalysis-Visual Analysis
- StockCharts.com
- Technical Analysis of the Financial Markets
- The Visual Investor
- VectorVest, Inc.
- Executive Premier Workshop
- One-Day Options Course
- OptionsPro
- Retirement Income Workshop
- Sure-Fire Trading Systems (VectorVest, Inc.)
- Trading as a Business Workshop
- VectorVest 7 EOD
- VectorVest 7 RealTime/IntraDay
- VectorVest AutoTester
- VectorVest Educational Services
- VectorVest OnLine
- VectorVest Options Analyzer
- VectorVest ProGraphics v6.0
- VectorVest ProTrader 7
- VectorVest RealTime Derby Tool
- VectorVest Simulator
- VectorVest Variator
- VectorVest Watchdog