HOT TOPICS LIST
- MACD
- Fibonacci
- RSI
- Gann
- ADXR
- Stochastics
- Volume
- Triangles
- Futures
- Cycles
- Volatility
- ZIGZAG
- MESA
- Retracement
- Aroon
INDICATORS LIST
LIST OF TOPICS
PRINT THIS ARTICLE
by Koos van der Merwe
Is Bank of America getting its house in order? Is it a BUY at current levels?
Position: Sell
Koos van der Merwe
Has been a technical analyst since 1969, and has worked as a futures and options trader with First Financial Futures in Johannesburg, South Africa.
PRINT THIS ARTICLE
ELLIOTT WAVE
Another Look At Bank of America
11/22/13 10:58:54 AMby Koos van der Merwe
Is Bank of America getting its house in order? Is it a BUY at current levels?
Position: Sell
| We all know that the banks have been in the doldrums, having to pay for their extreme enthusiasm and poor management during the mortgage-backed security bubble — an example of greed overcoming common sense. The share price of Bank of America has risen as buyers have bought at share price lows, but is it now the time to take profits, or should one hold for the long term? |

|
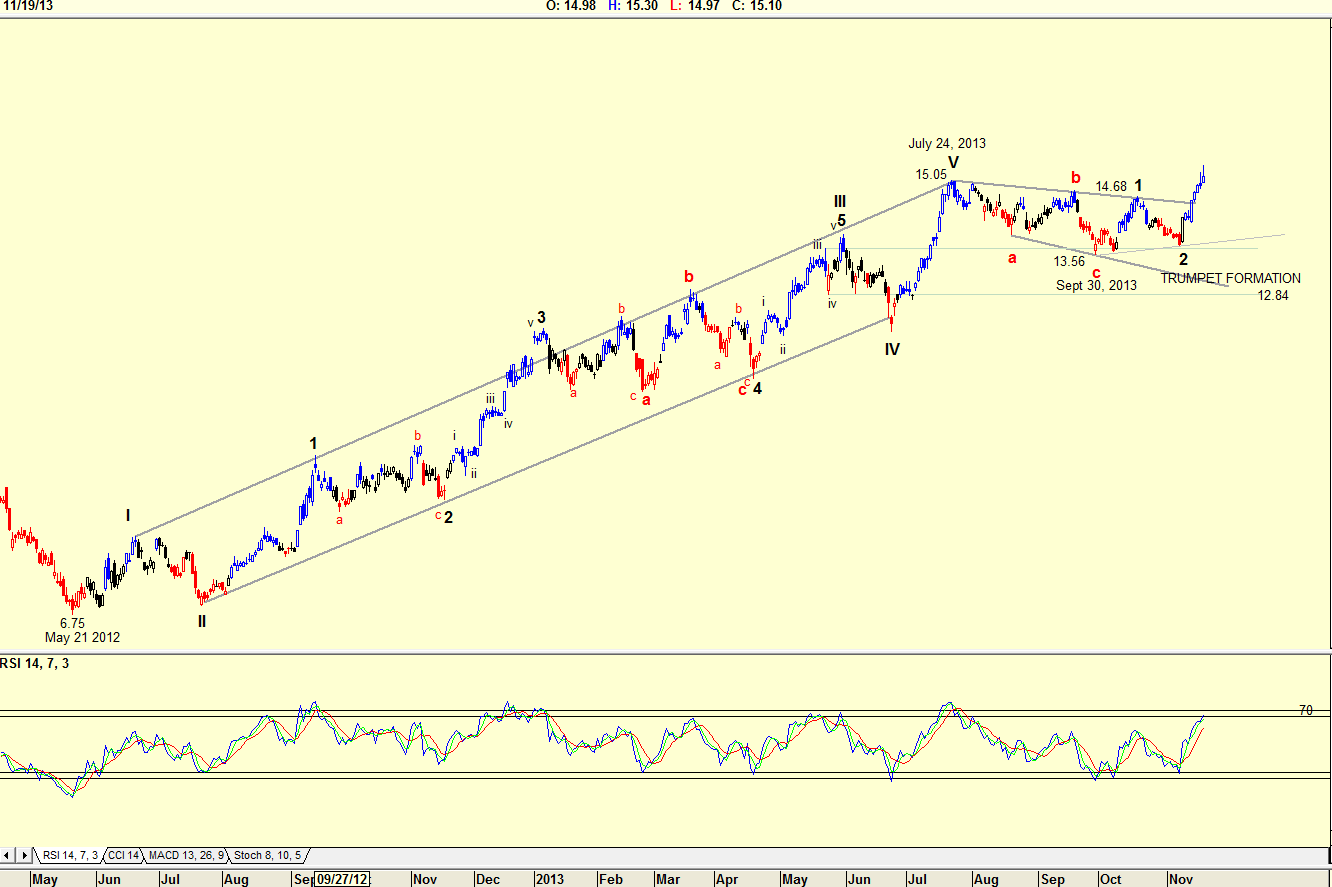
| Figure 1. Elliott Wave count of Bank of America showing trumpet formation. |
| Graphic provided by: AdvancedGET. |
| |
| My chart in Figure 1 is a daily chart of Bank of America, showing how the price has risen from a low of $6.75 on May 21, 2012 to a high of $15.05 by July 24, 2013. The Elliott Wave count shown on the chart does suggest that the correction that occurred from July 24th to September 30th 2013, when the price fell from $15.05 to $13.56, does look correct because the price fell to within the range of the 4th wave of lesser degree. The Elliott Wave count from September 30th is suggesting that a Wave 2 of a new bull trend is complete, and that the share price is now in a Wave 3. However, there is a suggestion of doubt, and that is the trumpet formation that has formed. A trumpet formation is where the trend lines widen as shown. This does suggest uncertainty, and the rule for uncertainty is "when in doubt, stay out". With the RSI indicator flirting with the 70 level, one can expect a correction to occur in the near future. The question is whether this correction will form a more decisive Elliott Wave ABC correction, with the price falling to as low as $12.84? To answer this question I will look at Figure 2. |

|
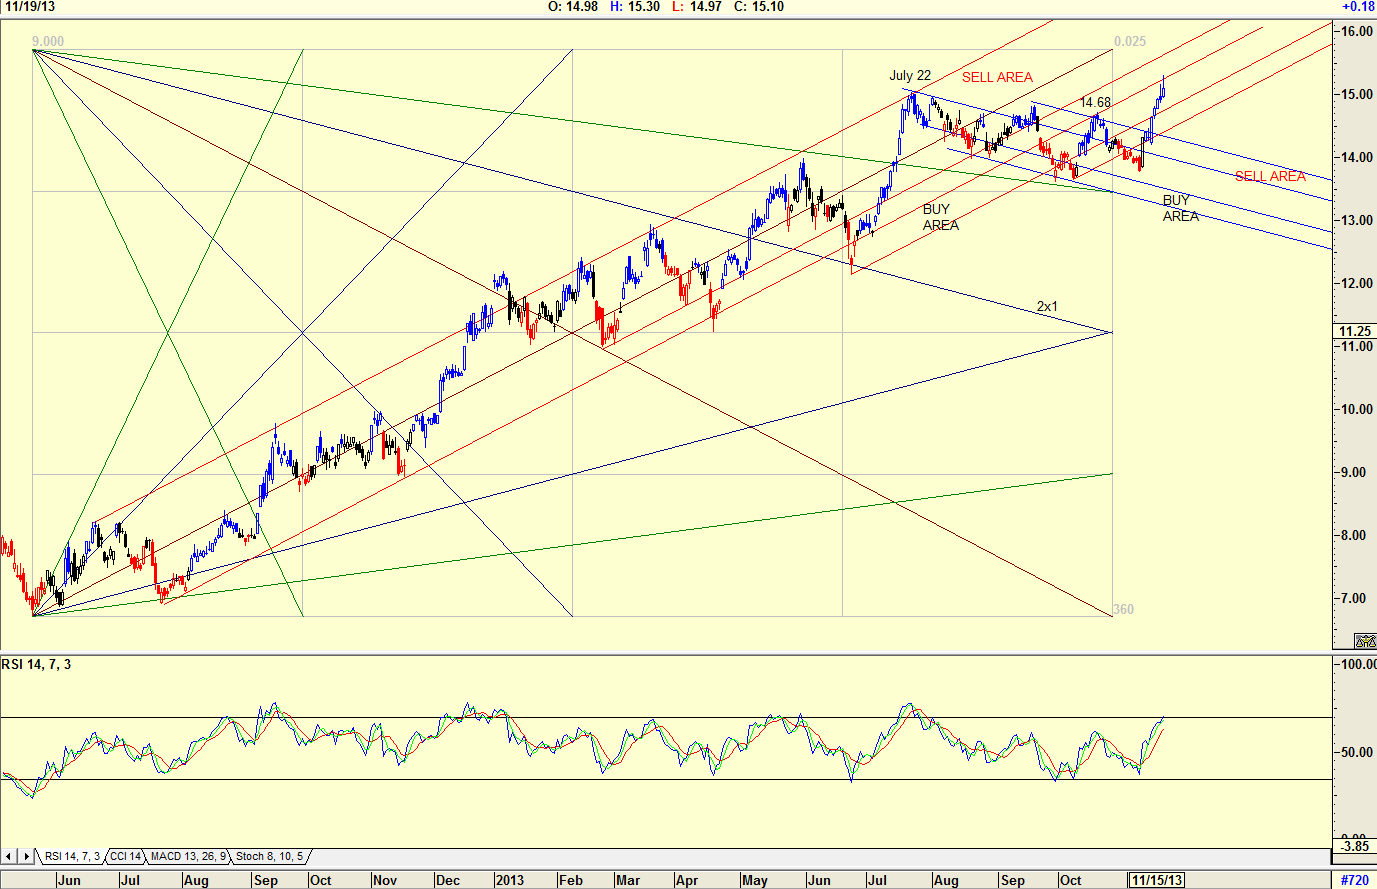
| Figure 2. Gann buy/sell lines suggesting a positive trend. |
| Graphic provided by: AdvancedGET. |
| |
| Looking at the chart in Figure 2, we can see how a Gann Fan, with 1x1 lines drawn from lows signalling buy and sell areas, gave a SELL signal but fell through the buy area, suggesting that the trend was now negative. The blue parallel lines to the Gann Fan 2x1 suggest a negative trend, and the chart shows that the price has broken through the down trend sell area, suggesting strength. I would not be a buyer of Bank of America at present levels, but would rather wait for a correction. The share price could either form a new ABC correction and fall into the Gann correction buy area, or test the $14.68 top of Wave 1 of what could be a new bull market. This is a share that is on my watch list. |
Has been a technical analyst since 1969, and has worked as a futures and options trader with First Financial Futures in Johannesburg, South Africa.
| Address: | 3256 West 24th Ave |
| Vancouver, BC | |
| Phone # for sales: | 6042634214 |
| E-mail address: | petroosp@gmail.com |
Click here for more information about our publications!
PRINT THIS ARTICLE

Request Information From Our Sponsors
- VectorVest, Inc.
- Executive Premier Workshop
- One-Day Options Course
- OptionsPro
- Retirement Income Workshop
- Sure-Fire Trading Systems (VectorVest, Inc.)
- Trading as a Business Workshop
- VectorVest 7 EOD
- VectorVest 7 RealTime/IntraDay
- VectorVest AutoTester
- VectorVest Educational Services
- VectorVest OnLine
- VectorVest Options Analyzer
- VectorVest ProGraphics v6.0
- VectorVest ProTrader 7
- VectorVest RealTime Derby Tool
- VectorVest Simulator
- VectorVest Variator
- VectorVest Watchdog
- StockCharts.com, Inc.
- Candle Patterns
- Candlestick Charting Explained
- Intermarket Technical Analysis
- John Murphy on Chart Analysis
- John Murphy's Chart Pattern Recognition
- John Murphy's Market Message
- MurphyExplainsMarketAnalysis-Intermarket Analysis
- MurphyExplainsMarketAnalysis-Visual Analysis
- StockCharts.com
- Technical Analysis of the Financial Markets
- The Visual Investor
