

HOT TOPICS LIST
- MACD
- Fibonacci
- RSI
- Gann
- ADXR
- Stochastics
- Volume
- Triangles
- Futures
- Cycles
- Volatility
- ZIGZAG
- MESA
- Retracement
- Aroon
INDICATORS LIST
LIST OF TOPICS
PRINT THIS ARTICLE
by Donald W. Pendergast, Jr.
Shares of Best Buy plunged nearly nine percent, setting the stage for yet more downside.
Position: N/A
Donald W. Pendergast, Jr.
Freelance financial markets writer and online publisher of the Trendzetterz.com S&P 500 Weekly Forecast service.
PRINT THIS ARTICLE
GAPS
Best Buy Becomes Big Sell as Key Support Shattered
11/22/13 10:48:56 AMby Donald W. Pendergast, Jr.
Shares of Best Buy plunged nearly nine percent, setting the stage for yet more downside.
Position: N/A
| Sometimes, good earnings news is interpreted by Wall Street as bad news, especially when a company warns that sales and revenues may be lower in the next quarter, thus setting the stage for an unexpected selloff in a stock. That was certainly the case on Tuesday for Best Buy (BBY), the home electronics/appliance chain. Q3 earnings came in at .18 per share, way above the .11 consensus estimates offered up by Wall Street analysts, and that was the good news part of the equation. However, the company also warned that its sales and profits for the final two months of Q4 2013 were likely going to be significantly lower than previously anticipated, and that was the bad news component that caused traders and investors to dump the stock en masse at the opening of Tuesday's trading session. Here's a closer look at BBY's daily chart, along with an idea on how to play further weakness in the stock in the days and weeks ahead. |
|
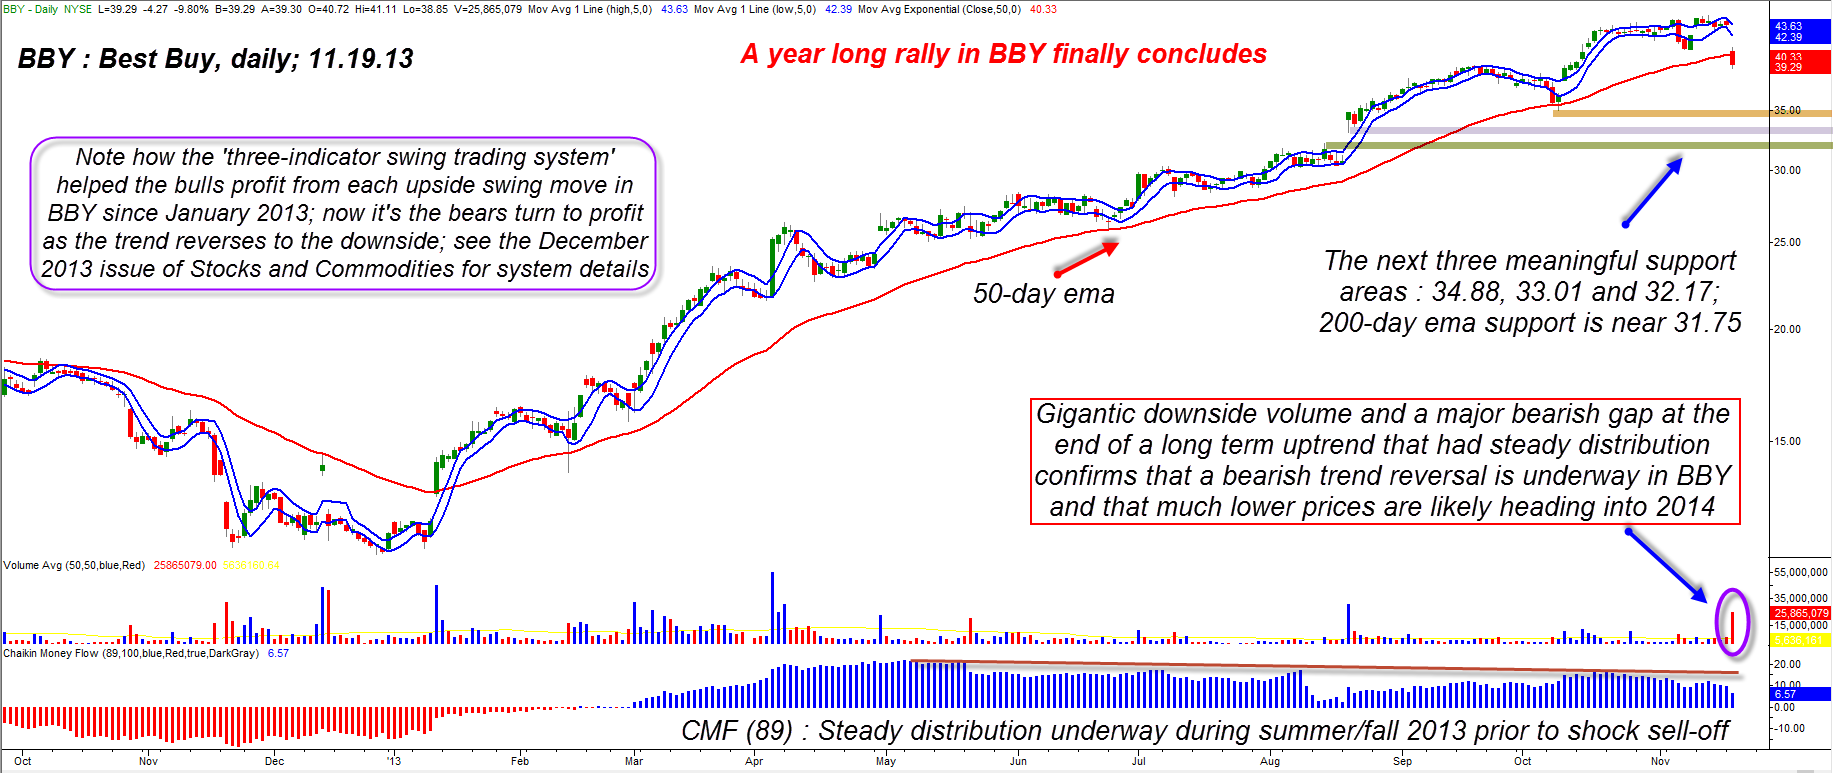
| Figure 1. Best Buy (BBY) had been under steady distribution during the summer/fall of 2013; the latest news of weak year-end sales forecasts was merely the precipitating event that triggered an already high-probability sell-off. |
| Graphic provided by: TradeStation. |
| |
| With the stock market right up near its all-time highs, it doesn't take much bad news to send a stock that's "priced to perfection" to sell-off as skittish investors and traders seek to protect their portfolios from the pain of a sudden, deep, market-wide correction. When BBY gapped lower by nearly 6% (-5.78%) on Tuesday morning, the stock managed to do several things at once, confirming a bearish trend reversal on its daily time frame: 1. It managed to pierce its 50-day exponential moving average (EMA) for the first time in six weeks. 2. It wiped out the open gains of the past five weeks. 3. It produced the most bearish combination of daily range and daily trading volume since November 20, 2012. Looking at BBY's daily graph over the past year, you can see that this new bearish reversal has the potential to bring the stock down to its next key support level within a relatively short period of time, especially if the major stock indexes also follow through with their own bearish trend reversals on their daily time frames. Big downside volume in conjunction with a large bearish gap — especially at the end of a major, long term rally — typically imply even more downside ahead in a given stock. This is especially true with liquid stocks (1 million or more shares of average daily trading volume) that are manifesting substantial price/money flow divergence patterns — as was the case for BBY going back as far as July/August 2013; the 89-day Chaikin Money flow histogram (CMF)(89) revealed that BBY was under distribution by the "smart money" then, with big institutions gradually scaling out of their long positions on each rally over the past 4 to 5 months. This new reversal confirms that they were right on track in lightening up — as they almost always are — in their BBY allocations. Retail traders and investors would always do well to note if there are notable bearish/bullish money flow or momentum divergences with price, particularly after sustained rallies or sell-offs, as it could help them avoid unnecessary losses from major reversals and/or help get them on alert for the next big move in a new direction. |
|
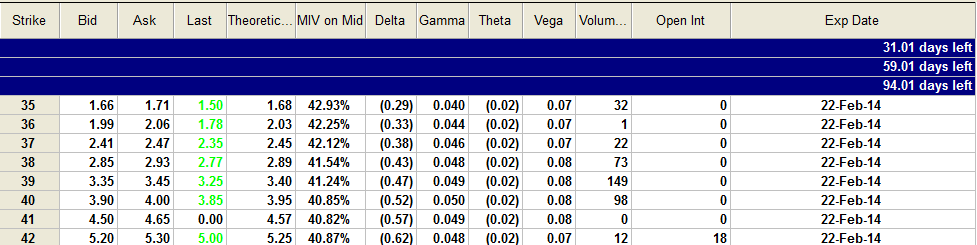
| Figure 2. Going long the February '14 BBY $40.00 put option may allow the bears more than enough time to capitalize on further weakness in Best Buy shares over the next month or two. |
| Graphic provided by: TradeStation. |
| Graphic provided by: TradeStation Option Analysis. |
| |
| The next strong support zone for BBY is near 34.88 (the October 9, 2013 swing low) and that may offer at least a temporary ledge for the stock to pause near or even stage a minor bounce from. Beneath that there is support near 33.01 and then 32.17, either of which may form the basis for the next 10 to 20-day cycle lows to form. There could be an attempt to close the new bearish gap soon, but that is unlikely until after at least one of the three aforementioned supports are tested and/or re-tested. BBY's 200-day EMA is near 31.75 and that could also be a strong price magnet after such a vicious turn southward in this large cap S&P 500 component, one that is so reliant on year-end sales for a a large chunk of its annual profits. Speculative bears may want to buy a slightly in the money put option with at least three months time value; the February '14 BBY $40.00 put looks like a relatively low-risk long put position here, one that could do very well, especially if BBY is destined to hit its 200-day EMA within the next 4 to 6 weeks, well before the put expires on the third Friday in February 2014. Savvy traders may want to buy four puts, using the aforementioned three support levels as profit targets, and the 200-day EMA as the ultimate profit target. Ideally, as BBY moves lower, you would take profit on one put at each of the 4 levels. The big idea with long put/call trades is to take logical profits at each key support/resistance level and to never let the put/call to ever lose more than 50% of its value if the trade fails to move in the right direction. This play is relatively low risk, so skilled option traders might consider risking 2% of their account value on this high-probability setup in BBY. Also, look for the major US stock indexes to finally break lower within the next week, setting up for a solid 5 to 6%% correction from their recent all-time highs. Trade wisely until we meet here again. |
Freelance financial markets writer and online publisher of the Trendzetterz.com S&P 500 Weekly Forecast service.
| Title: | Market consultant and writer |
| Company: | Trendzetterz |
| Address: | 81 Hickory Hollow Drive |
| Crossville, TN 38555 | |
| Phone # for sales: | 904-303-4814 |
| Website: | trendzetterz.com |
| E-mail address: | support@trendzetterz.com |
Traders' Resource Links | |
| Trendzetterz has not added any product or service information to TRADERS' RESOURCE. | |
Click here for more information about our publications!
Comments

Request Information From Our Sponsors
- StockCharts.com, Inc.
- Candle Patterns
- Candlestick Charting Explained
- Intermarket Technical Analysis
- John Murphy on Chart Analysis
- John Murphy's Chart Pattern Recognition
- John Murphy's Market Message
- MurphyExplainsMarketAnalysis-Intermarket Analysis
- MurphyExplainsMarketAnalysis-Visual Analysis
- StockCharts.com
- Technical Analysis of the Financial Markets
- The Visual Investor
- VectorVest, Inc.
- Executive Premier Workshop
- One-Day Options Course
- OptionsPro
- Retirement Income Workshop
- Sure-Fire Trading Systems (VectorVest, Inc.)
- Trading as a Business Workshop
- VectorVest 7 EOD
- VectorVest 7 RealTime/IntraDay
- VectorVest AutoTester
- VectorVest Educational Services
- VectorVest OnLine
- VectorVest Options Analyzer
- VectorVest ProGraphics v6.0
- VectorVest ProTrader 7
- VectorVest RealTime Derby Tool
- VectorVest Simulator
- VectorVest Variator
- VectorVest Watchdog