

HOT TOPICS LIST
- MACD
- Fibonacci
- RSI
- Gann
- ADXR
- Stochastics
- Volume
- Triangles
- Futures
- Cycles
- Volatility
- ZIGZAG
- MESA
- Retracement
- Aroon
INDICATORS LIST
LIST OF TOPICS
PRINT THIS ARTICLE
by Donald W. Pendergast, Jr.
Boeing shares have been on a bullish tear, but the appearance of a new gap after a powerful bullish swing move suggests that the stock is heading for a correction.
Position: N/A
Donald W. Pendergast, Jr.
Freelance financial markets writer and online publisher of the Trendzetterz.com S&P 500 Weekly Forecast service.
PRINT THIS ARTICLE
GAPS
High-Flier Boeing Stalls With Exhaustion Gap
11/19/13 05:16:23 PMby Donald W. Pendergast, Jr.
Boeing shares have been on a bullish tear, but the appearance of a new gap after a powerful bullish swing move suggests that the stock is heading for a correction.
Position: N/A
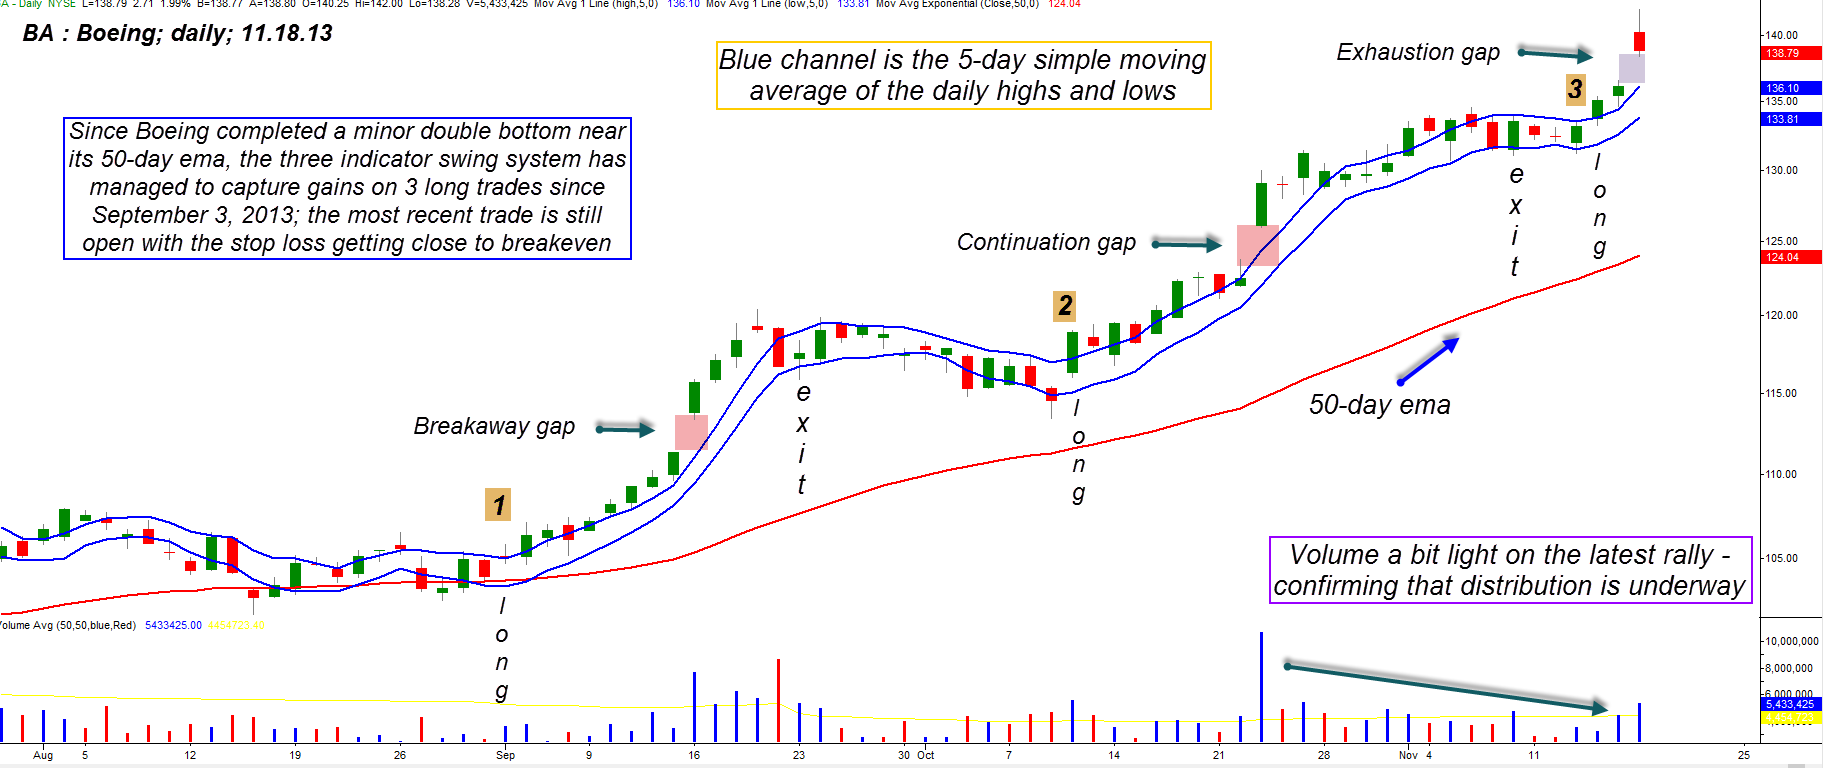
| Since completing a double bottom pattern in late summer 2013, shares of Boeing (BA) have risen by nearly 40% and are also trading at all-time highs. However, the appearance of an exhaustion gap in conjunction with this latest nosebleed high may be warning of an impending correction to lower altitudes. Here's a closer look. |
|
| Figure 1. Boeing (BA) has produced favorable trading results lately with a basic swing trading system that uses the intermediate-term trend as a confirmation filter. The new exhaustion candle may be warning that a bearish reversal is imminent, however. |
| Graphic provided by: TradeStation. |
| |
| The strength of the major US stock indexes continues to astound traders and technicians alike. With the Dow 30 now hitting the 16,000 level for the first time in history, bullish sentiment is indeed high. One of the leaders in the Dow 30 index (.DJIA, DIA, @YM) has been Boeing, and its perforomance over the past 11 weeks has been breathtaking; from a low of 102.57 on September 3, 2013, the stock rallied as high as 142.00 in early morning trading on November 18, 2013 -- a gain of 38.44 percent in 10 1/2 weeks. This rally has seen the appearance of three bullish price gaps (see Figure 1) and three valid long entry signals fired by the "Trading With Three Indicators" system (see December 2013 issue of Technical Analysis of Stocks & Commodities for details): 1st trade: Long @ 103.59 on September 3, 2013, Exit @ 116.07 on September 23, 2013. 2nd trade: Long @ 116.93 on October 10, 2013, Exit @ 131.60 on November 8, 2013. 3rd trade: Long @ 133.55 on November 14, 2013, still open Notice that all trade entries were taken in the same direction as the prevailing intermediate-term trend (using a 50-day exponential moving average or EMA); the first trade returned 12.04%, the second 12.44% and the most recent trade is up 3.69% as of this writing. For high-volume stocks and ETFs that tend to make regular swing moves -- such as BA -- this system has shown great promise, although it is by no means the world's greatest system, not by a longshot. However, for traders who have the patience to visually scan their daily charts for suitable stocks that make consistent swing moves several times a year, it shows great promise, especially when combined with fundamental analysis and relative strength studies. However, even a good swing/trend system can't predict when a trend will finally sputter and reverse direction, and that's when a trader needs to be aware of things like exhaustion gaps, money flow divergences, and market sentiment readings. In the case of BA we find that daily trading volumes have been weak on the latest rally (since late October 2013) and that an ominous exhaustion gap has made an unwelcome appearance just as BA hit a record high of 142.00; anyone currently long BA now would do well to run a closer trailing stop and/or take partial profits just in case this is "the" top for the stock's long-running uptrend since March 2009. |
|
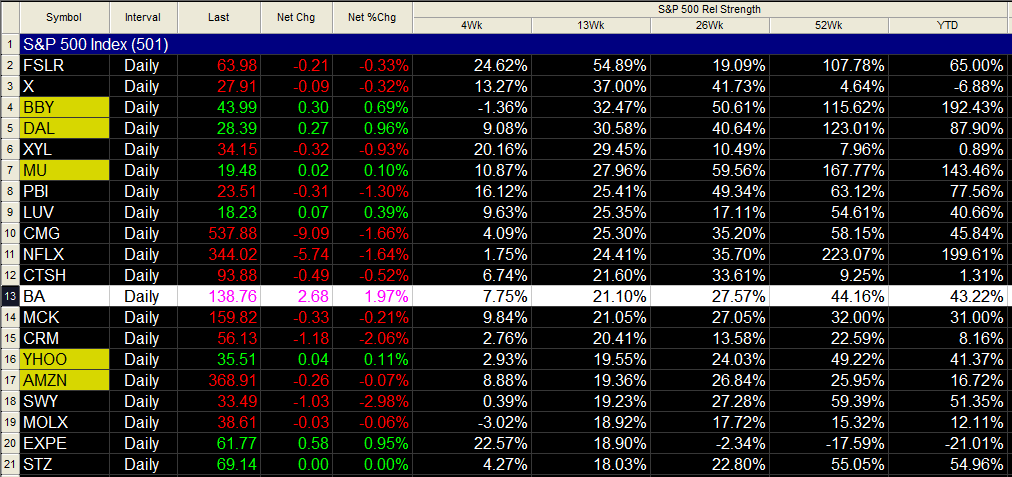
| Figure 2. Boeing (BA) has bullish relative strength vs. the S&P 500 index (.SPX) over the past 4-, 13-, 26- and 52-week periods and is also up more than 43% year-to-date. |
| Graphic provided by: TradeStation. |
| Graphic provided by: TradeStation RadarScreen. |
| |
| Now, I am not going to tell you the markets aren't going higher from here, as the Dow, S&P 500, and NASDAQ 100 could still make more gains heading into late November 2013. However, be aware that significant price/money flow divergences exist in all of the major stock index ETFs (DIA, SPY, MDY, QQQ and IWM) and that if you're considering going long here, be sure to do so with only a fraction of your usual cash allocations -- the risk level of a correction is simply too extreme to warrant taking full-size positions here. It's much safer to wait for a correction before adding any new longs now, no matter how bullish a stock's group sector or earnings growth trend is at the moment. And if a bear market begins as we head into 2014, it's good to know that the basic trading system you see at work on the long side in Boeing can also be put to work on the short side, once a stock or stock index ETF begins trading below its 50-day EMA. Trade wisely until we meet here again. |
Freelance financial markets writer and online publisher of the Trendzetterz.com S&P 500 Weekly Forecast service.
| Title: | Market consultant and writer |
| Company: | Trendzetterz |
| Address: | 81 Hickory Hollow Drive |
| Crossville, TN 38555 | |
| Phone # for sales: | 904-303-4814 |
| Website: | trendzetterz.com |
| E-mail address: | support@trendzetterz.com |
Traders' Resource Links | |
| Trendzetterz has not added any product or service information to TRADERS' RESOURCE. | |
Click here for more information about our publications!
Comments

Request Information From Our Sponsors
- VectorVest, Inc.
- Executive Premier Workshop
- One-Day Options Course
- OptionsPro
- Retirement Income Workshop
- Sure-Fire Trading Systems (VectorVest, Inc.)
- Trading as a Business Workshop
- VectorVest 7 EOD
- VectorVest 7 RealTime/IntraDay
- VectorVest AutoTester
- VectorVest Educational Services
- VectorVest OnLine
- VectorVest Options Analyzer
- VectorVest ProGraphics v6.0
- VectorVest ProTrader 7
- VectorVest RealTime Derby Tool
- VectorVest Simulator
- VectorVest Variator
- VectorVest Watchdog
- StockCharts.com, Inc.
- Candle Patterns
- Candlestick Charting Explained
- Intermarket Technical Analysis
- John Murphy on Chart Analysis
- John Murphy's Chart Pattern Recognition
- John Murphy's Market Message
- MurphyExplainsMarketAnalysis-Intermarket Analysis
- MurphyExplainsMarketAnalysis-Visual Analysis
- StockCharts.com
- Technical Analysis of the Financial Markets
- The Visual Investor