

HOT TOPICS LIST
- MACD
- Fibonacci
- RSI
- Gann
- ADXR
- Stochastics
- Volume
- Triangles
- Futures
- Cycles
- Volatility
- ZIGZAG
- MESA
- Retracement
- Aroon
INDICATORS LIST
LIST OF TOPICS
PRINT THIS ARTICLE
by Billy Williams
WLK is one stock that is taking the market higher, performing better than the market itself and showing real power...
Position: Buy
Billy Williams
Billy Williams has been trading the markets for 27 years, specializing in momentum trading with stocks and options.
PRINT THIS ARTICLE
TREND-CHANNEL
Westlake Chemical Corp. Breaking Higher
11/21/13 04:42:39 PMby Billy Williams
WLK is one stock that is taking the market higher, performing better than the market itself and showing real power...
Position: Buy
| The market is surging higher and you can see that the S&P 500 is gaining momentum which has caused for some pundits to call for the index to hit 2000 before year end. The seasonal end-of-year rally is certainly in effect and both traders and fund managers are taking advantage of the positive investor sentiment and market's momentum. This pattern typically occurs near the end of the 3rd quarter to the beginning of the 4th quarter for a calendar year as fund managers try to use their resources to cause a "mini-rally", pushing the market higher. Fund managers do this so that they can hit key benchmarks for their fund's performance to earn their annual performance bonuses. This is why it's important to keep a list of stock candidates that you've identified as leaders. Stocks that are identified as leaders tend to have greater Relative Strength than other stocks and trade closer to their all-time price high. As a result, they are likely to lead the rally, and you can take advantage of their price movement. One of these stock leaders, Westlake Chemical Corp. (WLK), has fired off an entry signal, made a significant move higher and may be setting up for a low-risk trade. |
|
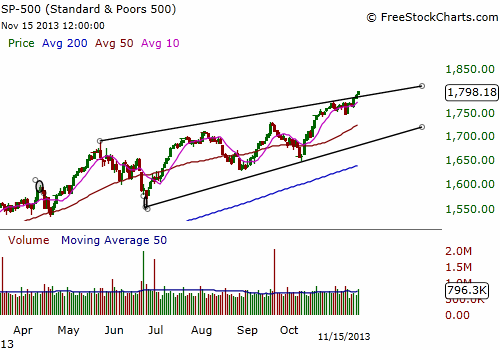
| Figure 1: The S&P 500 has had some wild price fluctuations but has still been trading higher. Its price action has tightened up in recent months and, now, has made a significant breakout to the upside. |
| Graphic provided by: www.freestockcharts.com. |
| |
| Currently, the S&P 500 is trading in an ascending zig-zag motion as price movement goes back and forth but moves higher overall. To the outsider, the market looks volatile, causing confusion to the untrained eye. But, to a smart technician, the S&P has been steadily advancing and gaining momentum to where it's now broken overhead resistance and broken its inverse upward trendline. |
|
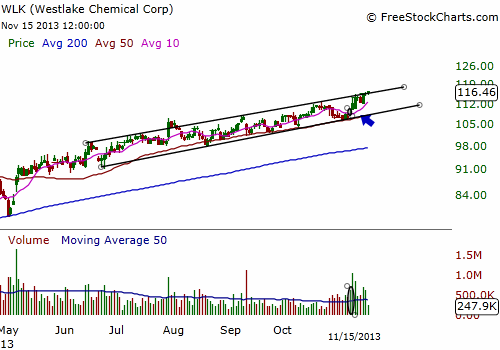
| Figure 2. WLK has maintained a tight trading range while still marching upward, forming an upward price channel. This shows remarkable strength by trading near its highs when the overall market has had much deeper pullbacks in price. |
| Graphic provided by: www.freestockcharts.com. |
| |
| Now, that price is above this critical price point, the strength of the market is now revealed and you can expect it to overflow down into the individual sectors and stocks. Eighty percent of stocks will follow the overall market's price action so the environment is positively bullish for stocks right now. WLK is also showing strength in its price action during this critical phase of the market's annual performance and is a strong candidate for a long position. |
|
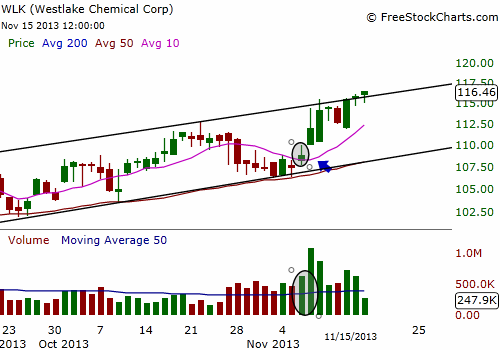
| Figure 3. WLK formed a pocket pivot entry near the bottom of its price channel. Going long on this signal while the rest of the market is showing momentum in favor of the bulls could mean significant gains from this point for WLK. |
| Graphic provided by: www.freestockcharts.com. |
| |
| The stock has been in a steady price trend that is easily identified from its yearly price chart. The steady up-and-down trading looks almost like a stair step where price marches steadily and rhythmically forward. Unlike the S&P's price action, which though it was bullish, was wide and wild in comparison. This means that the stock's price performance during this time was much stronger and resisted following the larger market during down times revealing a lot of high Relative Strength by resisting the market's downward pull during periods of decline. On November 6, 2013, WLK fired off a pocket pivot and has since broken out above its price channel's upward trendline, another bullish signal. |
|
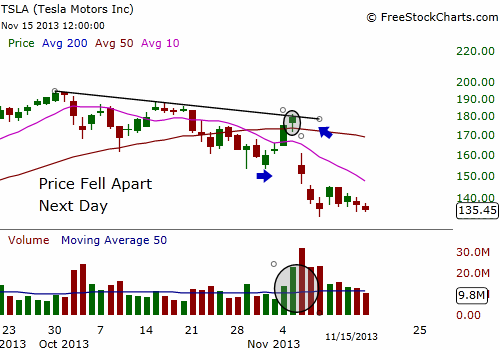
| Figure 4. Awhile back, in another article, it was pointed out that TSLA triggered a pocket pivot buy signal. The following day, on news of a flash fire in one of the company's manufactured vehicles, the stock cratered. While it's disappointing that a promising trade didn't work out, it stands as an important lesson as to why you always need to have stops in place to limit your risk. |
| Graphic provided by: www.freestockcharts.com. |
| |
| If you missed the pocket pivot entry, don't worry. Just wait for WLK to pullback and enter, or wait for price to trade back through its new price high. As a side note, TSLA was reported a few articles back having presented a pocket pivot buy signal, but then cratered the next day on news of one of their cars catching fire due to possible manufacturing problems. No one was hurt but the news caused stock to plummet the following day, triggering an exit from the position. Not all trades are winners and this is a good example of why you always want to use stops to protect your capital. |
Billy Williams has been trading the markets for 27 years, specializing in momentum trading with stocks and options.
| Company: | StockOptionSystem.com |
| E-mail address: | stockoptionsystem.com@gmail.com |
Traders' Resource Links | |
| StockOptionSystem.com has not added any product or service information to TRADERS' RESOURCE. | |
Click here for more information about our publications!
PRINT THIS ARTICLE

Request Information From Our Sponsors
- StockCharts.com, Inc.
- Candle Patterns
- Candlestick Charting Explained
- Intermarket Technical Analysis
- John Murphy on Chart Analysis
- John Murphy's Chart Pattern Recognition
- John Murphy's Market Message
- MurphyExplainsMarketAnalysis-Intermarket Analysis
- MurphyExplainsMarketAnalysis-Visual Analysis
- StockCharts.com
- Technical Analysis of the Financial Markets
- The Visual Investor
- VectorVest, Inc.
- Executive Premier Workshop
- One-Day Options Course
- OptionsPro
- Retirement Income Workshop
- Sure-Fire Trading Systems (VectorVest, Inc.)
- Trading as a Business Workshop
- VectorVest 7 EOD
- VectorVest 7 RealTime/IntraDay
- VectorVest AutoTester
- VectorVest Educational Services
- VectorVest OnLine
- VectorVest Options Analyzer
- VectorVest ProGraphics v6.0
- VectorVest ProTrader 7
- VectorVest RealTime Derby Tool
- VectorVest Simulator
- VectorVest Variator
- VectorVest Watchdog