HOT TOPICS LIST
- MACD
- Fibonacci
- RSI
- Gann
- ADXR
- Stochastics
- Volume
- Triangles
- Futures
- Cycles
- Volatility
- ZIGZAG
- MESA
- Retracement
- Aroon
INDICATORS LIST
LIST OF TOPICS
PRINT THIS ARTICLE
by Koos van der Merwe
As the housing market in the US starts recovering, is it time to invest in companies that are in the housing business and pay a pleasant dividend?
Position: Buy
Koos van der Merwe
Has been a technical analyst since 1969, and has worked as a futures and options trader with First Financial Futures in Johannesburg, South Africa.
PRINT THIS ARTICLE
RSI
Going For REIT Yields
11/21/13 04:13:24 PMby Koos van der Merwe
As the housing market in the US starts recovering, is it time to invest in companies that are in the housing business and pay a pleasant dividend?
Position: Buy
| My answer to the question above is "yes", but you should choose what share to invest in with caution. For example, would you invest in a dividend or interest paying REIT, like American Capital Agency Corp (AGNC) or other REITS that pay a high yield in the 14% region? Or would you go for a company like National Retail Properties that offers a far lower yield in the region of 4%-5%. The phrase "too good to be true" is always there, but, let's face it, a yield of 14% is so tempting. But what about the risk involved? Let us look at the charts of both companies. |

|
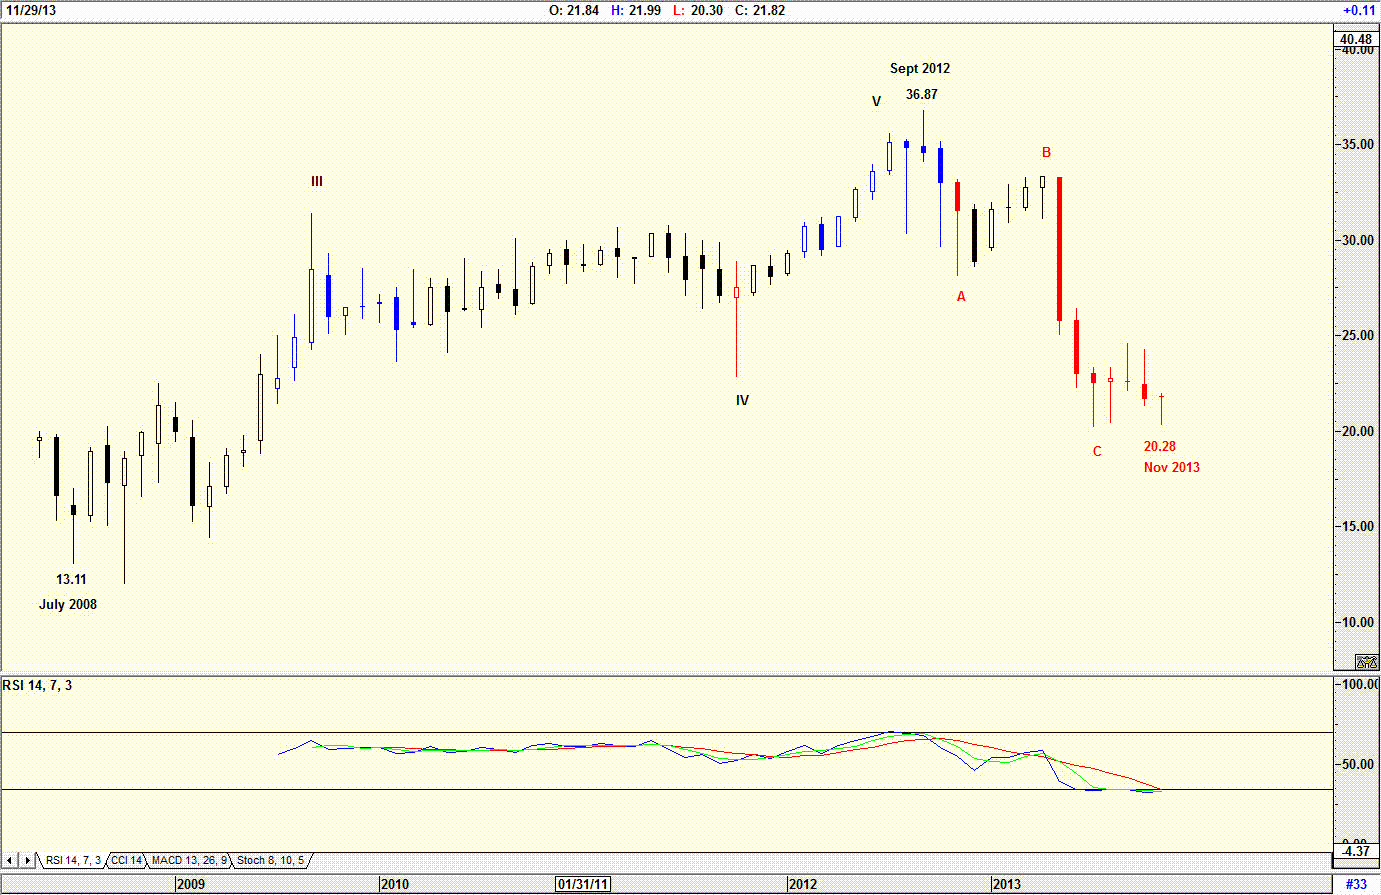
| Figure 1. Monthly chart of American Capital Agency Corp. (AGNC). |
| Graphic provided by: AdvancedGET. |
| |
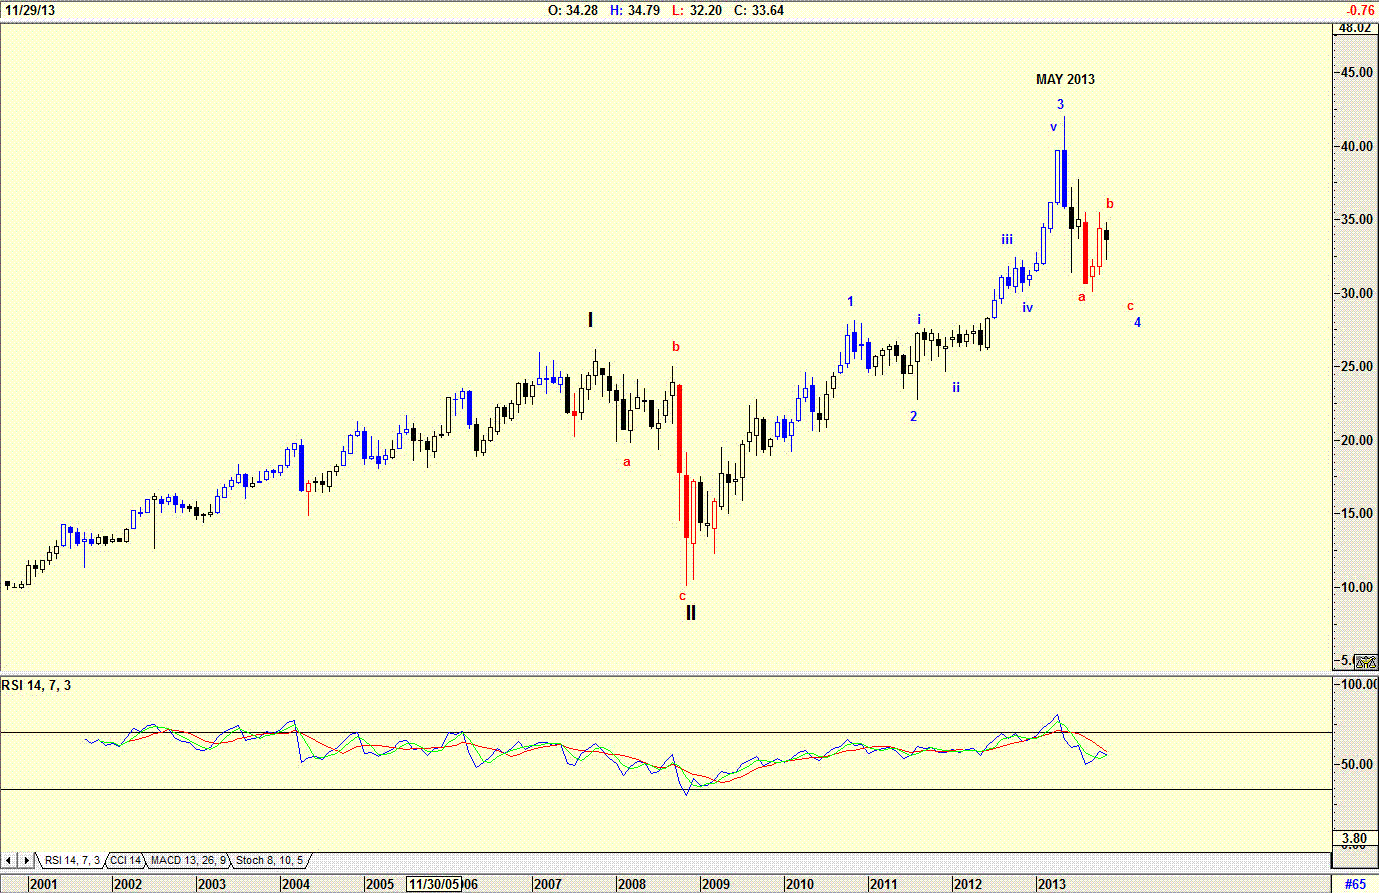
| The chart in Figure 1 is a monthly chart of American Capital Agency Corp (AGNC) and shows how the price rose from a low of $13.11 in July 2008 to a high of $36.87 by September 2012. The share price then started falling and trading at $21.48 (as of November 15, 2013). Anybody would want to know why the price is falling. The monthly chart of National Retail Properties in Figure 2 shows that although the stock has been rising since 2009, the RSI has started heading lower. |

|
| Figure 2. Monthly chart of National Retail Properties (NNN). |
| Graphic provided by: AdvancedGET. |
| |
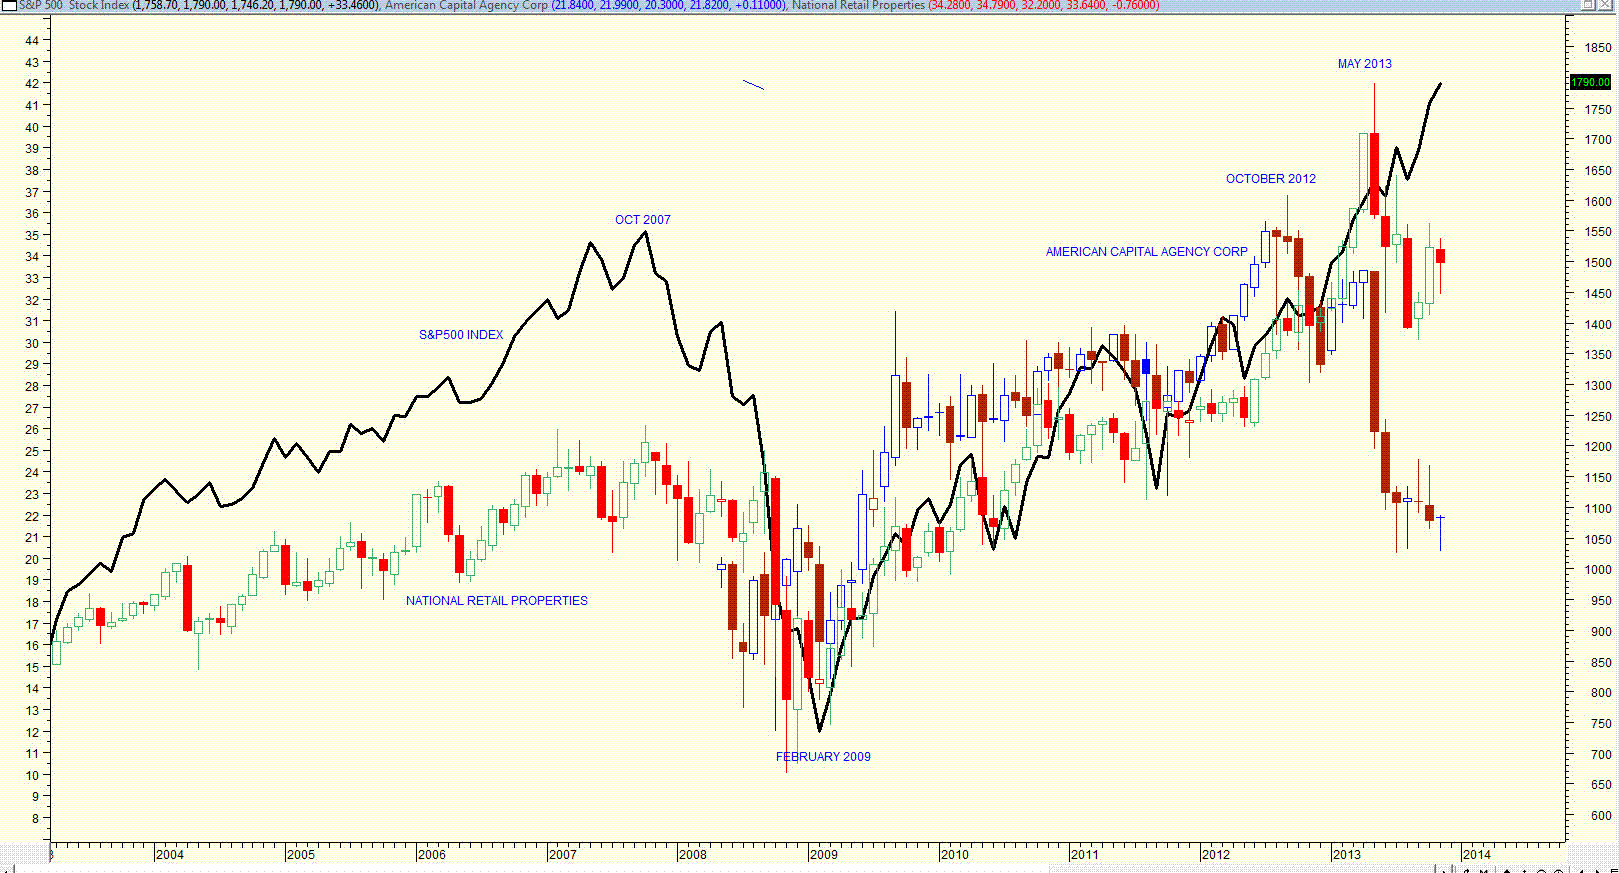
| The chart in Figure 3 is a monthly chart showing the S&P500 index, with a chart of AGNC and NNN superimposed. Note how the S&P500 Index is still in a bull trend. Note also how AGNC topped out in October 2012 and started falling, whereas NNN only started falling in May 2013, seven months later. So do you buy AGNC and collect a high yield, or do you wait for the correction of NNN to end, and be happy with a lower yield? |

|
| Figure 3. Monthly chart of AGNC, NNN, and S&P 500 Index. |
| Graphic provided by: AdvancedGET. |
| |
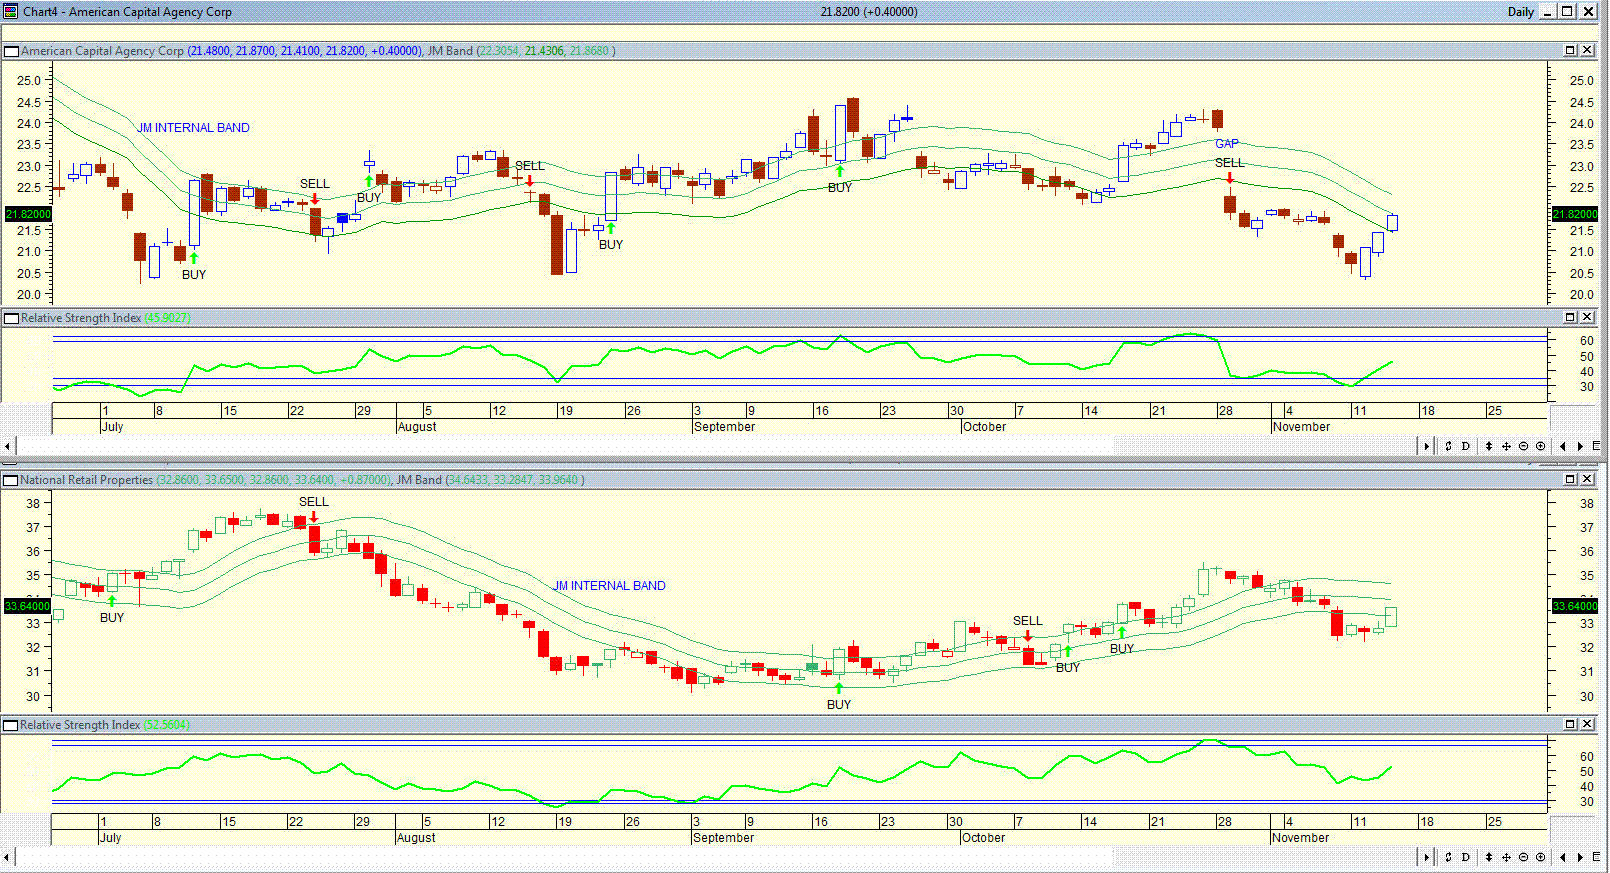
| The chart in Figure 4 is a daily chart of both AGNC and NNN. The chart shows that both shares are rising. However, the RSI indicator on AGNC has given a buy signal whereas the RSI on NNN has not fallen into buy territory, that is, below the 32 level. Note also the gap on the AGNC chart suggesting that the share price should rise to fill the gap. Both charts show a JM Internal Band. A JM Internal Band is a 15-period simple moving average offset by 2% positive and 2% negative. A move above the upper band suggests a buy signal. |

|
| Figure 4. Daily chart of AGNC and NNN. |
| Graphic provided by: AdvancedGET. |
| |
| Janet Yellen during the week, said that the US Federal Reserve will not consider tapering in the near future. A buy of an interest bearing REIT could be something to look at. With AGNC offering a higher yield than NNN, taking the risk of buying the stock could be worth it. |
Has been a technical analyst since 1969, and has worked as a futures and options trader with First Financial Futures in Johannesburg, South Africa.
| Address: | 3256 West 24th Ave |
| Vancouver, BC | |
| Phone # for sales: | 6042634214 |
| E-mail address: | petroosp@gmail.com |
Click here for more information about our publications!
Comments

|

Request Information From Our Sponsors
- StockCharts.com, Inc.
- Candle Patterns
- Candlestick Charting Explained
- Intermarket Technical Analysis
- John Murphy on Chart Analysis
- John Murphy's Chart Pattern Recognition
- John Murphy's Market Message
- MurphyExplainsMarketAnalysis-Intermarket Analysis
- MurphyExplainsMarketAnalysis-Visual Analysis
- StockCharts.com
- Technical Analysis of the Financial Markets
- The Visual Investor
- VectorVest, Inc.
- Executive Premier Workshop
- One-Day Options Course
- OptionsPro
- Retirement Income Workshop
- Sure-Fire Trading Systems (VectorVest, Inc.)
- Trading as a Business Workshop
- VectorVest 7 EOD
- VectorVest 7 RealTime/IntraDay
- VectorVest AutoTester
- VectorVest Educational Services
- VectorVest OnLine
- VectorVest Options Analyzer
- VectorVest ProGraphics v6.0
- VectorVest ProTrader 7
- VectorVest RealTime Derby Tool
- VectorVest Simulator
- VectorVest Variator
- VectorVest Watchdog
