HOT TOPICS LIST
- MACD
- Fibonacci
- RSI
- Gann
- ADXR
- Stochastics
- Volume
- Triangles
- Futures
- Cycles
- Volatility
- ZIGZAG
- MESA
- Retracement
- Aroon
INDICATORS LIST
LIST OF TOPICS
PRINT THIS ARTICLE
by Donald W. Pendergast, Jr.
With the four-year long bear market in shares of China BAK Battery, Inc. now a done deal, the stock appears to be preparing for a possible move up toward its next key resistance levels.
Position: N/A
Donald W. Pendergast, Jr.
Freelance financial markets writer and online publisher of the Trendzetterz.com S&P 500 Weekly Forecast service.
PRINT THIS ARTICLE
MOVING AVERAGES
CBAK: Bullish Moving Average Cross
11/15/13 03:35:37 PMby Donald W. Pendergast, Jr.
With the four-year long bear market in shares of China BAK Battery, Inc. now a done deal, the stock appears to be preparing for a possible move up toward its next key resistance levels.
Position: N/A
| Some stocks really know how to lose virtually all of their value — as in a 98% decline in less than four years — and then stage a near-miraculous turnaround that leaves market technicians and retail traders dumbstruck. Here's a look at one such stock, one that may be in prime position to stage a near-term rally. |

|
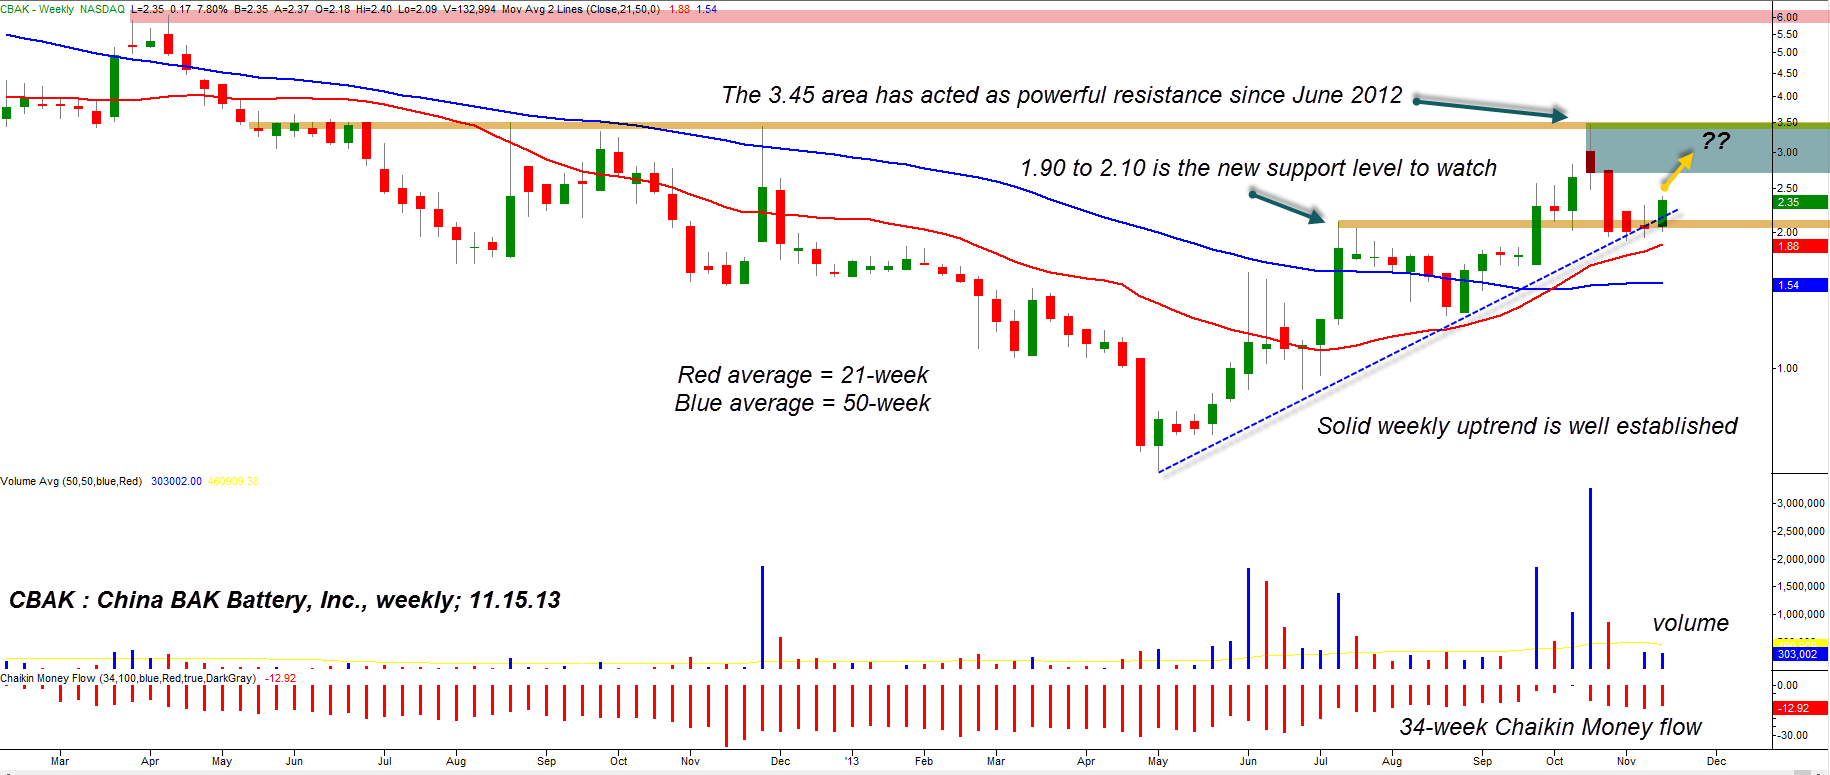
| Figure 1. Now that key support has been successfully tested, CBAK may have an above average shot at hitting its next set of major resistance levels. |
| Graphic provided by: TradeStation. |
| |
| Shares of China BAK Battery (CBAK) made a major cycle high (the second high of a major double top pattern) on October 2, 2009 at a price of 26.10 and then proceeded to descend into the deep dark valley of bear market territory, a trip south that lasted until the stock hit rock bottom at a mere 59 cents on May 3, 2013 (Figure 1). That's a 97.73% revaluation, or a monthly decline of about 2.27%, on average. Hopefully, no one was foolish enough to "buy the dips" all the way down, hoping for a quick turnaround! Those who bought in at sub-2.00 levels have already seen a nice gain so far, with the possibility of more gains soon: 1. The 21- and 50-week simple moving averages (SMA) recently completed a bullish crossover; typically, there is a correction back toward the 21-week average after such a cross and that's exactly what CBAK did, too. If a stock finds support at either the 10- or 21-week average after such a cross and then reverses higher with a bullish, wide range candle, the odds are good for more upside to come. 2. CBAK can usually be counted on to reverse near strong areas of prior support/resistance (particularly if using weekly chart numbers for S/R), and since it has now successfully tested support at the 10- or 21- week averages, the logical conclusion is that it may now move higher to test key resistance near the 2.75 to 3.45 area, which is the boundary zone that includes the top/bottom of two adjacent high volume and/or wide range weekly candles — this resistance area is highlighted in green on the chart. Notice that the 3.45 area at the top of the shaded area is strong resistance; a break above this level would be bullish indeed for CBAK. In the meantime, however, 3.45 should be viewed as a definite profit-taking zone for any new long entries. Weekly money flow is still technically bearish but is showing some signs of minor accumulation; daily chart money flows are in better shape for the bulls, however. |

|
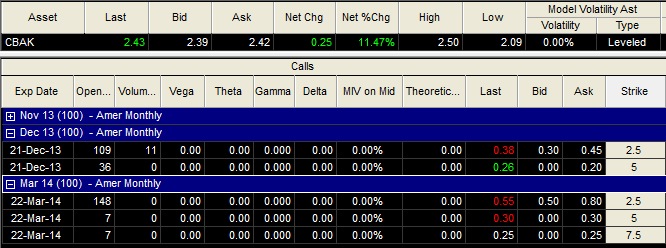
| Figure 2. Bid-ask spreads in CBAK call options are very wide, making them unattractive for all but the most skilled traders to purchase or sell. |
| Graphic provided by: TradeStation. |
| Graphic provided by: TradeStation OptionAnalysis. |
| |
| Perhaps the simplest way to play CBAK on the long side here is to buy the stock on a break above Friday's highs (currently at 2.50) and then hold on for a possible ride up to 2.75 and/or 3.45. The initial stop should be near 2.05 and a two to three bar trailing stop of the daily lows should be a decent way to manage the position. Conservative traders may want to take half profits near 2.75 to 2.80, letting the rest run for a possible attempt to hit resistance at 3.45. Account risk should be kept at 2% or less, no matter how bullish this price action appears to be. |
| By keeping tabs on where the main support/resistance levels are, you can better determine if a trade opportunity is attractive — or not. In the case of CBAK, the odds of a successful bullish trade appear to be good, especially since the broad markets are still hitting fresh all-time highs. Trade wisely until we meet here again. |
Freelance financial markets writer and online publisher of the Trendzetterz.com S&P 500 Weekly Forecast service.
| Title: | Market consultant and writer |
| Company: | Trendzetterz |
| Address: | 81 Hickory Hollow Drive |
| Crossville, TN 38555 | |
| Phone # for sales: | 904-303-4814 |
| Website: | trendzetterz.com |
| E-mail address: | support@trendzetterz.com |
Traders' Resource Links | |
| Trendzetterz has not added any product or service information to TRADERS' RESOURCE. | |
Click here for more information about our publications!
Comments
Date: 11/27/13Rank: 5Comment: Very helpful information. You should write more often. Thanks!

|

Request Information From Our Sponsors
- StockCharts.com, Inc.
- Candle Patterns
- Candlestick Charting Explained
- Intermarket Technical Analysis
- John Murphy on Chart Analysis
- John Murphy's Chart Pattern Recognition
- John Murphy's Market Message
- MurphyExplainsMarketAnalysis-Intermarket Analysis
- MurphyExplainsMarketAnalysis-Visual Analysis
- StockCharts.com
- Technical Analysis of the Financial Markets
- The Visual Investor
- VectorVest, Inc.
- Executive Premier Workshop
- One-Day Options Course
- OptionsPro
- Retirement Income Workshop
- Sure-Fire Trading Systems (VectorVest, Inc.)
- Trading as a Business Workshop
- VectorVest 7 EOD
- VectorVest 7 RealTime/IntraDay
- VectorVest AutoTester
- VectorVest Educational Services
- VectorVest OnLine
- VectorVest Options Analyzer
- VectorVest ProGraphics v6.0
- VectorVest ProTrader 7
- VectorVest RealTime Derby Tool
- VectorVest Simulator
- VectorVest Variator
- VectorVest Watchdog
