

HOT TOPICS LIST
- MACD
- Fibonacci
- RSI
- Gann
- ADXR
- Stochastics
- Volume
- Triangles
- Futures
- Cycles
- Volatility
- ZIGZAG
- MESA
- Retracement
- Aroon
INDICATORS LIST
LIST OF TOPICS
PRINT THIS ARTICLE
by Donald W. Pendergast, Jr.
Shares of Forest Labs are on a strong bullish tear, and may be a great covered call play.
Position: N/A
Donald W. Pendergast, Jr.
Freelance financial markets writer and online publisher of the Trendzetterz.com S&P 500 Weekly Forecast service.
PRINT THIS ARTICLE
FRX: Multiyear Highs And Bullish Momentum
11/15/13 03:27:44 PMby Donald W. Pendergast, Jr.
Shares of Forest Labs are on a strong bullish tear, and may be a great covered call play.
Position: N/A
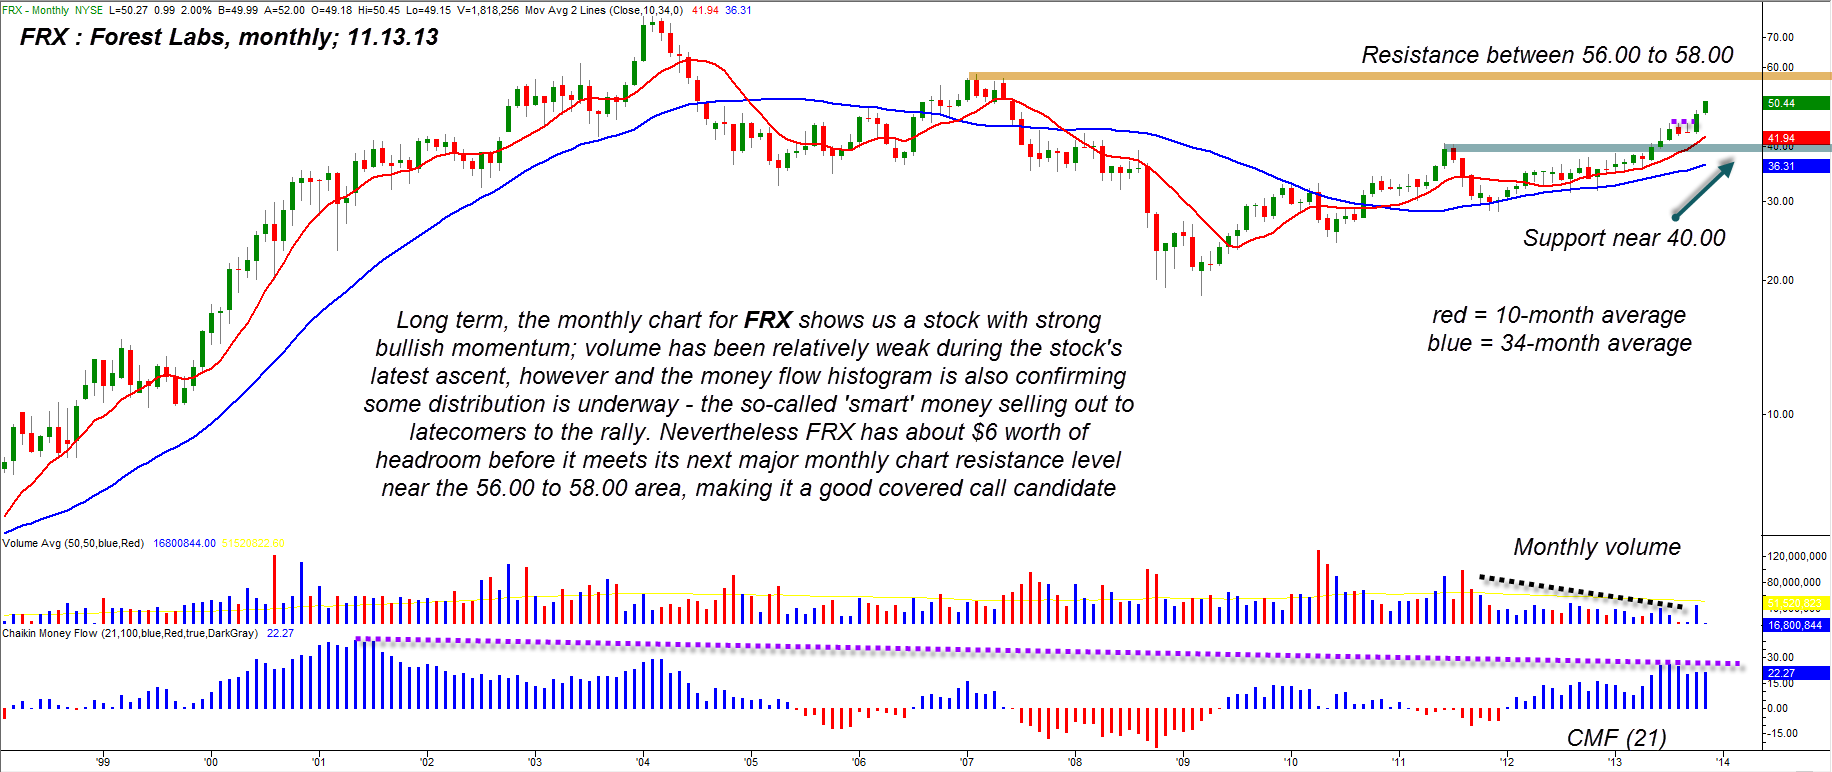
| Since emerging from a market-wide nulticycle low in mid-November 2012, shares of Forest Labs (FRX) are up by nearly 60% and are now beginning to accelerate higher. With the S&P 500 index also making new multiyear (and all-time) highs, this could be a good time for covered call trades in high momentum, bullish stocks that have room to run until hitting major resistance. Here's a closer look at the monthly chart for Forest Labs (FRX). |
|
| Figure 1. Forest Labs (FRX) uptrend is gaining new upside momentum as the stock attempts to make it up to its next key resistance level near 56.00 to 58.00. |
| Graphic provided by: TradeStation. |
| |
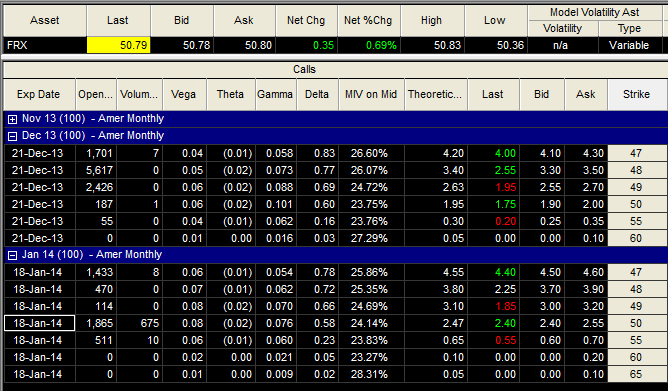
| Since the major market lows of March 2009, FRX has experienced a solid, steady uptrend — rising from 18.37 all the way to 51.07 in the span of 56 months (Figure 1). That's a gain of 178% or about 3.15% per month on average. Glancing at the monthly chart of FRX it's easy to see that the 10- and 34-month simple moving averages (SMA) have proven the trend worthiness of this health care sector stock over the long haul; the 10-week average is especially good for those using weekly and monthly charts to identify attractive times to put on covered call trades of various durations, and using the 10-period average on the weekly and monthly can help you stay on the right side of long-term momentum most, if not all, of the time. Presently, FRX has just broken higher from a small consolidation pattern and looks set to run higher as its next significant resistance level starts in the mid-56.00 area, extending up toward the 58.00 area; institutional traders appear to still have a decent position on in FRX even with the new breakout, but expect them to progressively lighten up should the aforementioned resistance barrier be reached in the first quarter of 2014. Until that level is hit, however, the upside momentum in FRX should be more than enough to allow for a two-month covered call trade with above-average opportunity for a modest profit. Here are the pertinent details: 1. As long as FRX stays above 51.00, consider buying one January '14 FRX $50.00 call option for every 100-share lot of FRX you own or plan to soon acquire. This call option has healthy open interest of 1,885 contracts and a daily trading volume of more than 600 contracts as of today's writing. Daily time decay (theta) comes in at $2 per day, per contract and will begin to accelerate noticeably during the final 30 days of the option's lifespan. Expiry occurs on the third friday of January 2014 (on the 17th). 2. Once in the trade use the 10-week moving average as a general trailing stop; if FRX manages to clear 53.00, however, begin using a one-week trailing stop of the lows for the remainder of the trade's duration. If you get a daily close, below the trail, close out the entire position; if the 56.00 area is reached, consider closing out your entire position if you only have one covered call and at least half of your position if you have more than one. More conservative (nervous) traders can simply use the weekly lows as the trail for the life of the trade; they too need to take profits when/if 56.00 is reached on this particular breakout. |
|
| Figure 2. The January '14 FRX $50.00 call has very strong open interest figure, with more than 1,800 contracts as of this writing. |
| Graphic provided by: TradeStation. |
| Graphic provided by: TradeStation OptionAnalysis. |
| |
| The bulls are still in control of the major US stock indexes, but numerous technical and sentiment indicators are warning that we are much, much closer to the end of the bullish rally than we are to the beginning of it. Be sure to fully check the fundamentals of any new long position you intend to put on from here on out, and consider using more modest cash allocations into each trade. Trade wisely until we meet here again. |
Freelance financial markets writer and online publisher of the Trendzetterz.com S&P 500 Weekly Forecast service.
| Title: | Market consultant and writer |
| Company: | Trendzetterz |
| Address: | 81 Hickory Hollow Drive |
| Crossville, TN 38555 | |
| Phone # for sales: | 904-303-4814 |
| Website: | trendzetterz.com |
| E-mail address: | support@trendzetterz.com |
Traders' Resource Links | |
| Trendzetterz has not added any product or service information to TRADERS' RESOURCE. | |
Click here for more information about our publications!
Comments
Date:�11/20/13Rank:�5Comment:�
Date:�11/27/13Rank:�5Comment:�Very good!

Request Information From Our Sponsors
- StockCharts.com, Inc.
- Candle Patterns
- Candlestick Charting Explained
- Intermarket Technical Analysis
- John Murphy on Chart Analysis
- John Murphy's Chart Pattern Recognition
- John Murphy's Market Message
- MurphyExplainsMarketAnalysis-Intermarket Analysis
- MurphyExplainsMarketAnalysis-Visual Analysis
- StockCharts.com
- Technical Analysis of the Financial Markets
- The Visual Investor
- VectorVest, Inc.
- Executive Premier Workshop
- One-Day Options Course
- OptionsPro
- Retirement Income Workshop
- Sure-Fire Trading Systems (VectorVest, Inc.)
- Trading as a Business Workshop
- VectorVest 7 EOD
- VectorVest 7 RealTime/IntraDay
- VectorVest AutoTester
- VectorVest Educational Services
- VectorVest OnLine
- VectorVest Options Analyzer
- VectorVest ProGraphics v6.0
- VectorVest ProTrader 7
- VectorVest RealTime Derby Tool
- VectorVest Simulator
- VectorVest Variator
- VectorVest Watchdog