HOT TOPICS LIST
- MACD
- Fibonacci
- RSI
- Gann
- ADXR
- Stochastics
- Volume
- Triangles
- Futures
- Cycles
- Volatility
- ZIGZAG
- MESA
- Retracement
- Aroon
INDICATORS LIST
LIST OF TOPICS
PRINT THIS ARTICLE
by Koos van der Merwe
Cisco Systems, Inc. is continually in the news, and when they have a bad quarterly report, it makes new headlines.
Position: Accumulate
Koos van der Merwe
Has been a technical analyst since 1969, and has worked as a futures and options trader with First Financial Futures in Johannesburg, South Africa.
PRINT THIS ARTICLE
GAPS
Cisco Systems, Inc.
11/15/13 03:03:25 PMby Koos van der Merwe
Cisco Systems, Inc. is continually in the news, and when they have a bad quarterly report, it makes new headlines.
Position: Accumulate
| Cisco Systems, Inc. (CSCO) fell more than 12% as its first-quarter revenue came up short of expectations and the company cut its second-quarter guidance. The weakness in Asia Pacific, Japan and China, and emerging market orders were the reason for the poor performance. The company took a haircut on revenues from its data-center switching, enterprise wireless, and service provider routing businesses due to major technology transitions. So, would you buy the share in anticipation of a future rise in price? |

|
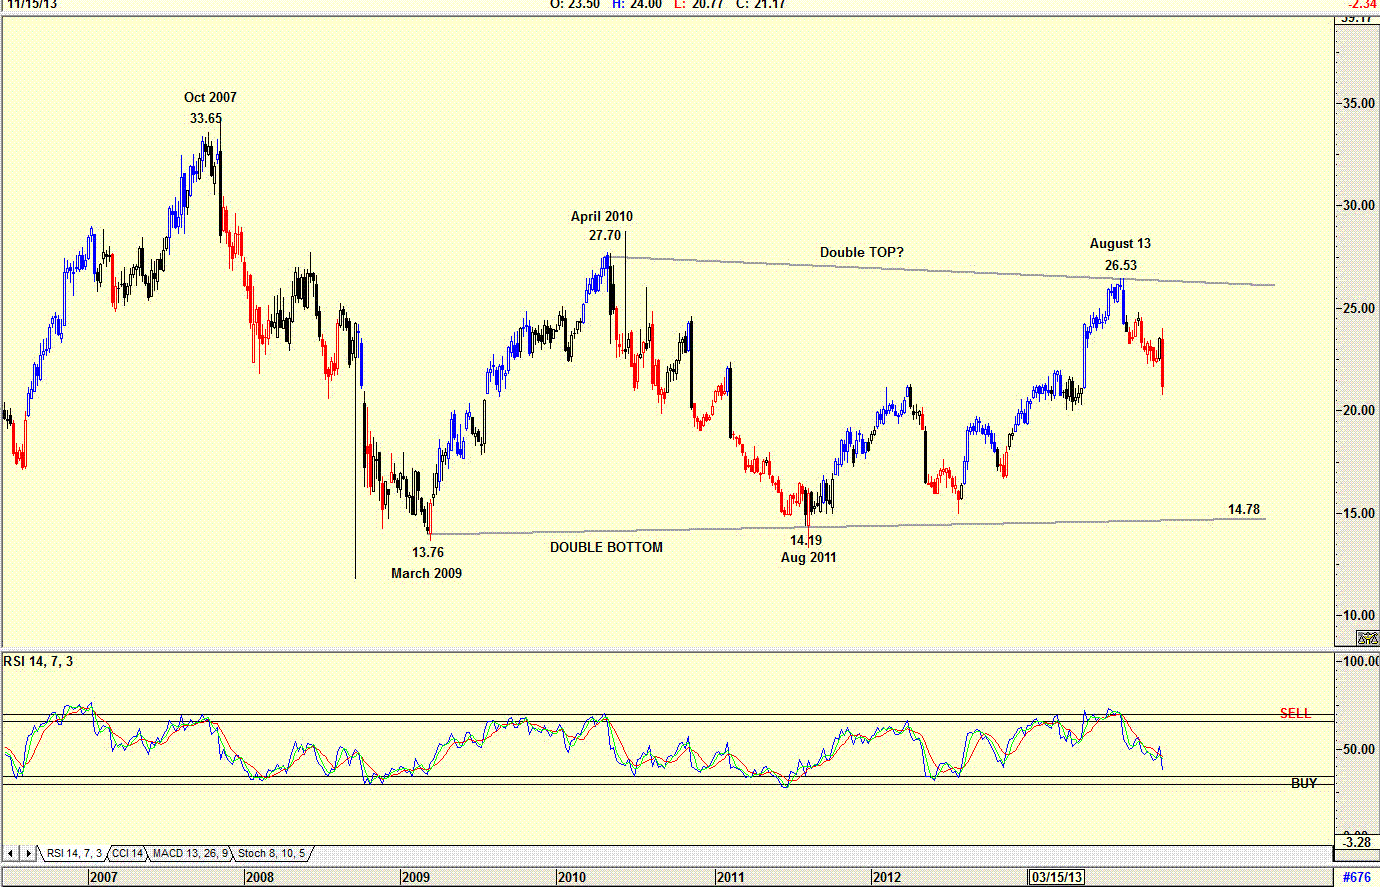
| Figure 1. Weekly chart for CSCO. |
| Graphic provided by: AdvancedGET. |
| |
| The chart in Figure 1 is a weekly chart showing the share price formed a double bottom which saw the share price rise from $14.19 in August 2011 to $26.53 by August 2013. The two tops do suggest that a double top formed suggesting that the price should fall to retest the support line at $14.78. The sell signal of August 13, 2013 was called by the RSI indicator. |

|
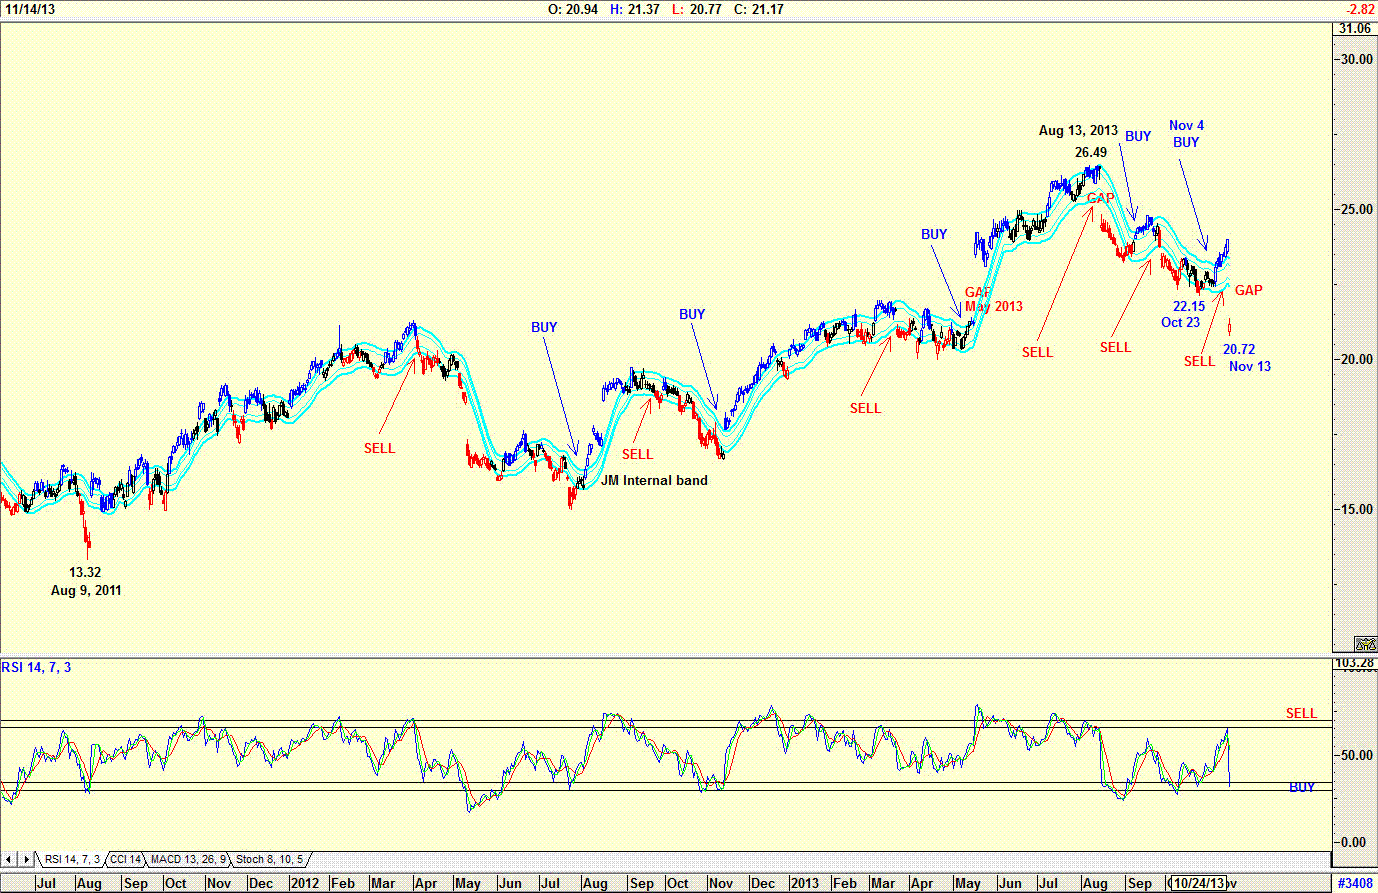
| Figure 2. Daily chart for CSCO showing the gaps and expected rise in the share price. |
| Graphic provided by: AdvancedGET. |
| |
| The chart in Figure 2 shows how the share price rose from a low of $13.32 on August 9, 2011 to a high of $26.49 by August 13, 2013, probably one of the reasons the share price attracted so much media attention. The May 2013 gap however would have warned investors that the price would drop to fill the gap, and it did, by October 23, 2013 when it fell to $22.15. The price should then start rising, and the price did start rising with the JM Internal Band indicator giving a buy on November 4, 2014. The JM Internal band is a 15-period simple moving average (SMA) offset by 2% positive and 2% negative. A break above the upper band signals a buy and a break below the lower band, a sell. The sell signal given on November 13, 2013 with the fall in price to $20.72 is therefore unexpected. The gap created by the fall is suggesting that the price should rise to fill the gap, sometime in the near future. CSCO is a share on my watch list, and I shall buy it on an RSI buy signal, because the price should rise to fill the gap. |
Has been a technical analyst since 1969, and has worked as a futures and options trader with First Financial Futures in Johannesburg, South Africa.
| Address: | 3256 West 24th Ave |
| Vancouver, BC | |
| Phone # for sales: | 6042634214 |
| E-mail address: | petroosp@gmail.com |
Click here for more information about our publications!
PRINT THIS ARTICLE

|

Request Information From Our Sponsors
- VectorVest, Inc.
- Executive Premier Workshop
- One-Day Options Course
- OptionsPro
- Retirement Income Workshop
- Sure-Fire Trading Systems (VectorVest, Inc.)
- Trading as a Business Workshop
- VectorVest 7 EOD
- VectorVest 7 RealTime/IntraDay
- VectorVest AutoTester
- VectorVest Educational Services
- VectorVest OnLine
- VectorVest Options Analyzer
- VectorVest ProGraphics v6.0
- VectorVest ProTrader 7
- VectorVest RealTime Derby Tool
- VectorVest Simulator
- VectorVest Variator
- VectorVest Watchdog
- StockCharts.com, Inc.
- Candle Patterns
- Candlestick Charting Explained
- Intermarket Technical Analysis
- John Murphy on Chart Analysis
- John Murphy's Chart Pattern Recognition
- John Murphy's Market Message
- MurphyExplainsMarketAnalysis-Intermarket Analysis
- MurphyExplainsMarketAnalysis-Visual Analysis
- StockCharts.com
- Technical Analysis of the Financial Markets
- The Visual Investor
