

HOT TOPICS LIST
- MACD
- Fibonacci
- RSI
- Gann
- ADXR
- Stochastics
- Volume
- Triangles
- Futures
- Cycles
- Volatility
- ZIGZAG
- MESA
- Retracement
- Aroon
INDICATORS LIST
LIST OF TOPICS
PRINT THIS ARTICLE
by Donald W. Pendergast, Jr.
Up by as much as 60% since early October 2013, shares of Martha Stewart 'A' my be preparing for a minor pullback.
Position: N/A
Donald W. Pendergast, Jr.
Freelance financial markets writer and online publisher of the Trendzetterz.com S&P 500 Weekly Forecast service.
PRINT THIS ARTICLE
SUPPORT & RESISTANCE
MSO: Parabolic Rise Toward Key Resistance
11/13/13 04:33:46 PMby Donald W. Pendergast, Jr.
Up by as much as 60% since early October 2013, shares of Martha Stewart 'A' my be preparing for a minor pullback.
Position: N/A
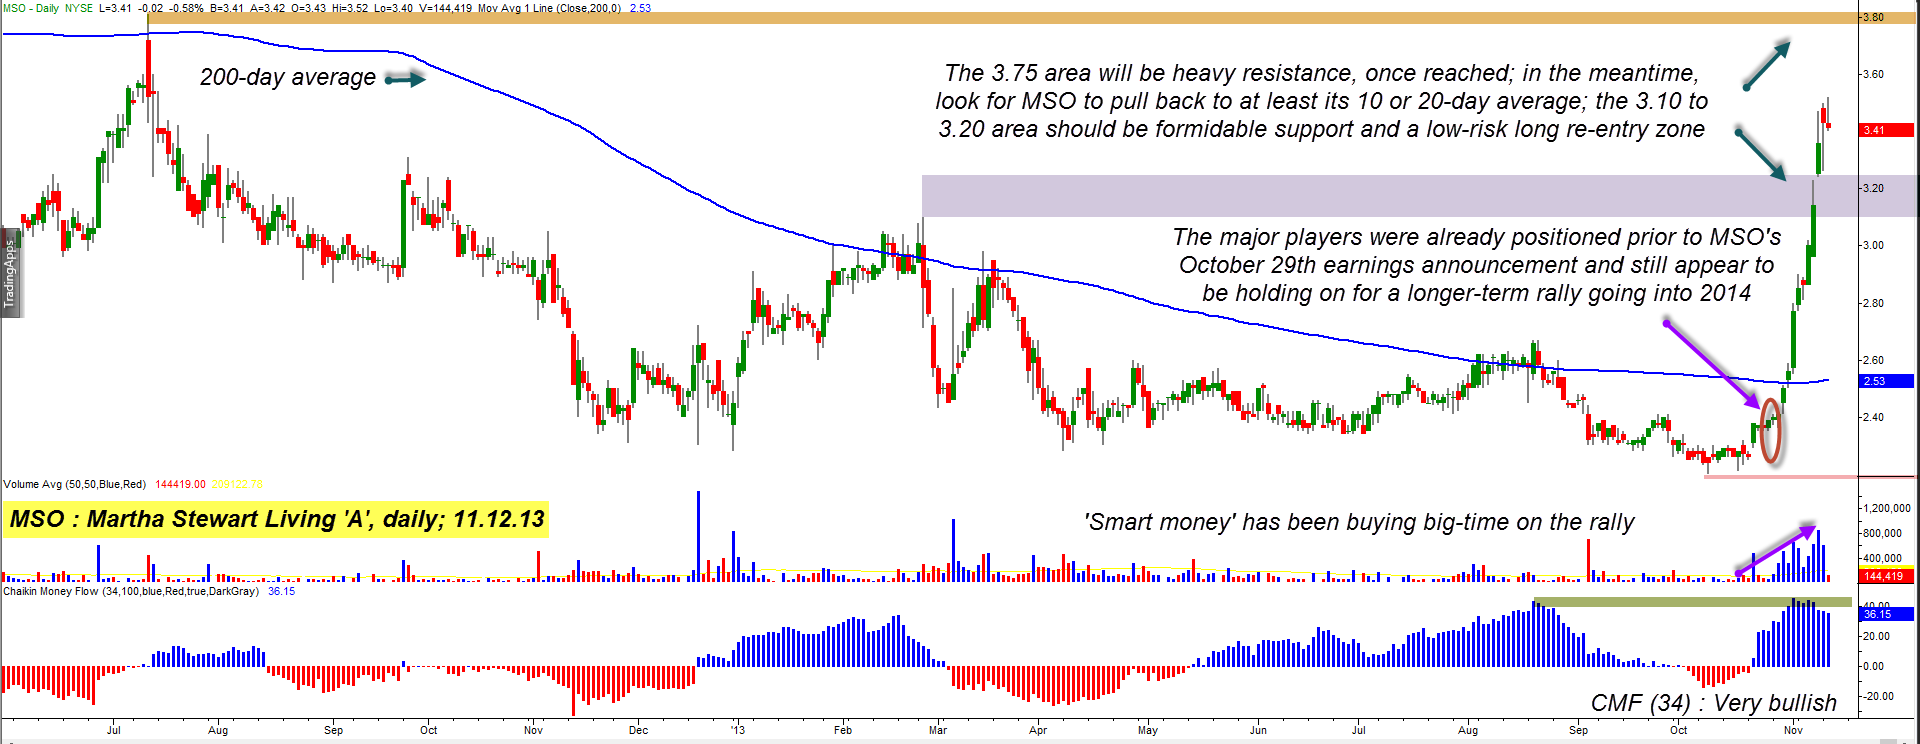
| Being a low-priced (under $5 per share) stock, shares of Martha Stewart 'A' tend to be a bit erratic in their ability to make "clean" swing/trending moves, particularly on a daily or intraday time frame. But since staging a powerful bullish breakout in the last week of October 2013, the stock is trending higher in a parabolic rise that has added more than 50% to the stock's value, making it a bit easier to predict what its near-term direction is likely going to be. Here's a closer look (Figure 1). |
|
| Figure 1. After such a sharp rise, a proportional pullback toward key support (violet shaded zone) should offer the bulls a fairly low-risk buying opportunity; the next key resistance level is near 3.75 (gold line). |
| Graphic provided by: TradeStation. |
| |
| MSO bottomed out in relatively unconvincing fashion on October 9, 2013 at a bargain-basement price of $2.20 per share and held steady for two weeks after which the stock gapped higher just six days before its earnings release of October 29, 2013. This gap higher — on heavy volume and wide range — was the initial tip-off that the big institutional players were beginning to pile into the stock, and when earnings were released a few days later the stock began its astounding parabolic rise up to the 3.50 area in rapid fashion. Earnings and earnings-derived fundamentals truly are the raw power driving stocks higher or lower; in this case MSO simply met its consensus earnings estimates of minus 6 cents per share, and that it didn't lose even more was seen as a net positive for the big money folks who routinely ignite the major rallies in virtually every listed stock in the world. Presently, MSO is still up about 50% sine its pre-earnings bottom, trading far, far above its 200-day simple moving average (SMA) and is pulling back slightly after making an interim high on the morning of November 12, 2013 and could offer traders a new low-risk buy point within the next week or so: 1. Money flow is healthy — based on the 34-day Chaikin Money flow histogram — with strong trading volumes and bullish, wide range price bars marking the trail toward the recent high. 2. The next strong resistance area for MSO isn't until the $3.75 area, meaning that a bit more of a pullback to strong support will set up a bullish swing trade with a favorable risk-reward ratio. 3. After most sharp runs higher from a basing pattern, there is usually another group of traders and investors who want to get on the proverbial bandwagon; a pullback to support in the 3.10-3.20 zone should be a prime spot to expect latecomers to pile into MSO, hoping for another surge higher. And they may just get it, too, as there is no sign yet that the strong hands in this stock are selling out and that means a solid "floor" of price support to enable even latecomers to drive up price to the next key resistance level of 3.75. |
|
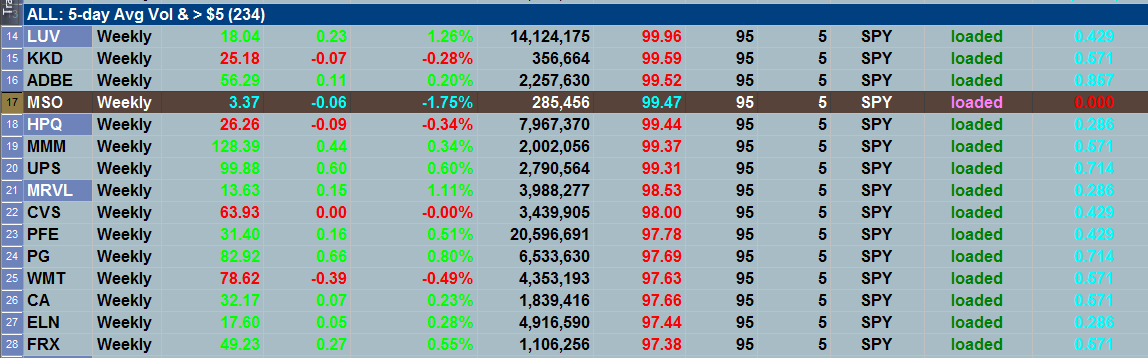
| Figure 2. MSO's 2-day RSI reading is north of 99.00; note that the stock is non-correlated with SPY, unlike UPS and ADBE, which are also overbought on a short-term basis. |
| Graphic provided by: TradeStation. |
| Graphic provided by: TradeStation RadarScreen. |
| |
| Playing MSO on the long side here is easy, but will require a bit of patience, too: 1. Wait for a pullback toward at least the 3.10 to 3.25 area and then look for the two or four-day RSI indicator to turn up again. 2. Go long one tick (.01) above the high of the bar causing the RSI to turn higher (preferably from an RSI level below 10.00). 3. Manage the long position with a three bar trailing stop, setting your profit target for the 3.70-3.75 area. 4. Consider taking most of your profits near that target zone unless you are convinced that the stock's fundamentals should help MSO beak above the resistance area with little delay. Risking 1% of your account value on this trade might be appropriate (calculate your risk based on an initial stop placement near the 3.05 level), given that the smart money is not yet selling out in large scale. The major US indexes are still vulnerable to a correction, but until that happens, this potential setup in MOS looks like a good opportunity on the long side. Trade wisely until we meet here again. |
Freelance financial markets writer and online publisher of the Trendzetterz.com S&P 500 Weekly Forecast service.
| Title: | Market consultant and writer |
| Company: | Trendzetterz |
| Address: | 81 Hickory Hollow Drive |
| Crossville, TN 38555 | |
| Phone # for sales: | 904-303-4814 |
| Website: | trendzetterz.com |
| E-mail address: | support@trendzetterz.com |
Traders' Resource Links | |
| Trendzetterz has not added any product or service information to TRADERS' RESOURCE. | |
Click here for more information about our publications!
PRINT THIS ARTICLE

Request Information From Our Sponsors
- StockCharts.com, Inc.
- Candle Patterns
- Candlestick Charting Explained
- Intermarket Technical Analysis
- John Murphy on Chart Analysis
- John Murphy's Chart Pattern Recognition
- John Murphy's Market Message
- MurphyExplainsMarketAnalysis-Intermarket Analysis
- MurphyExplainsMarketAnalysis-Visual Analysis
- StockCharts.com
- Technical Analysis of the Financial Markets
- The Visual Investor
- VectorVest, Inc.
- Executive Premier Workshop
- One-Day Options Course
- OptionsPro
- Retirement Income Workshop
- Sure-Fire Trading Systems (VectorVest, Inc.)
- Trading as a Business Workshop
- VectorVest 7 EOD
- VectorVest 7 RealTime/IntraDay
- VectorVest AutoTester
- VectorVest Educational Services
- VectorVest OnLine
- VectorVest Options Analyzer
- VectorVest ProGraphics v6.0
- VectorVest ProTrader 7
- VectorVest RealTime Derby Tool
- VectorVest Simulator
- VectorVest Variator
- VectorVest Watchdog