HOT TOPICS LIST
- MACD
- Fibonacci
- RSI
- Gann
- ADXR
- Stochastics
- Volume
- Triangles
- Futures
- Cycles
- Volatility
- ZIGZAG
- MESA
- Retracement
- Aroon
INDICATORS LIST
LIST OF TOPICS
PRINT THIS ARTICLE
by Donald W. Pendergast, Jr.
Shares of home improvement retailer Home Depot are descending toward a key support zone.
Position: N/A
Donald W. Pendergast, Jr.
Freelance financial markets writer and online publisher of the Trendzetterz.com S&P 500 Weekly Forecast service.
PRINT THIS ARTICLE
SUPPORT & RESISTANCE
Home Depot: Approaching Support Area
11/12/13 04:27:11 PMby Donald W. Pendergast, Jr.
Shares of home improvement retailer Home Depot are descending toward a key support zone.
Position: N/A
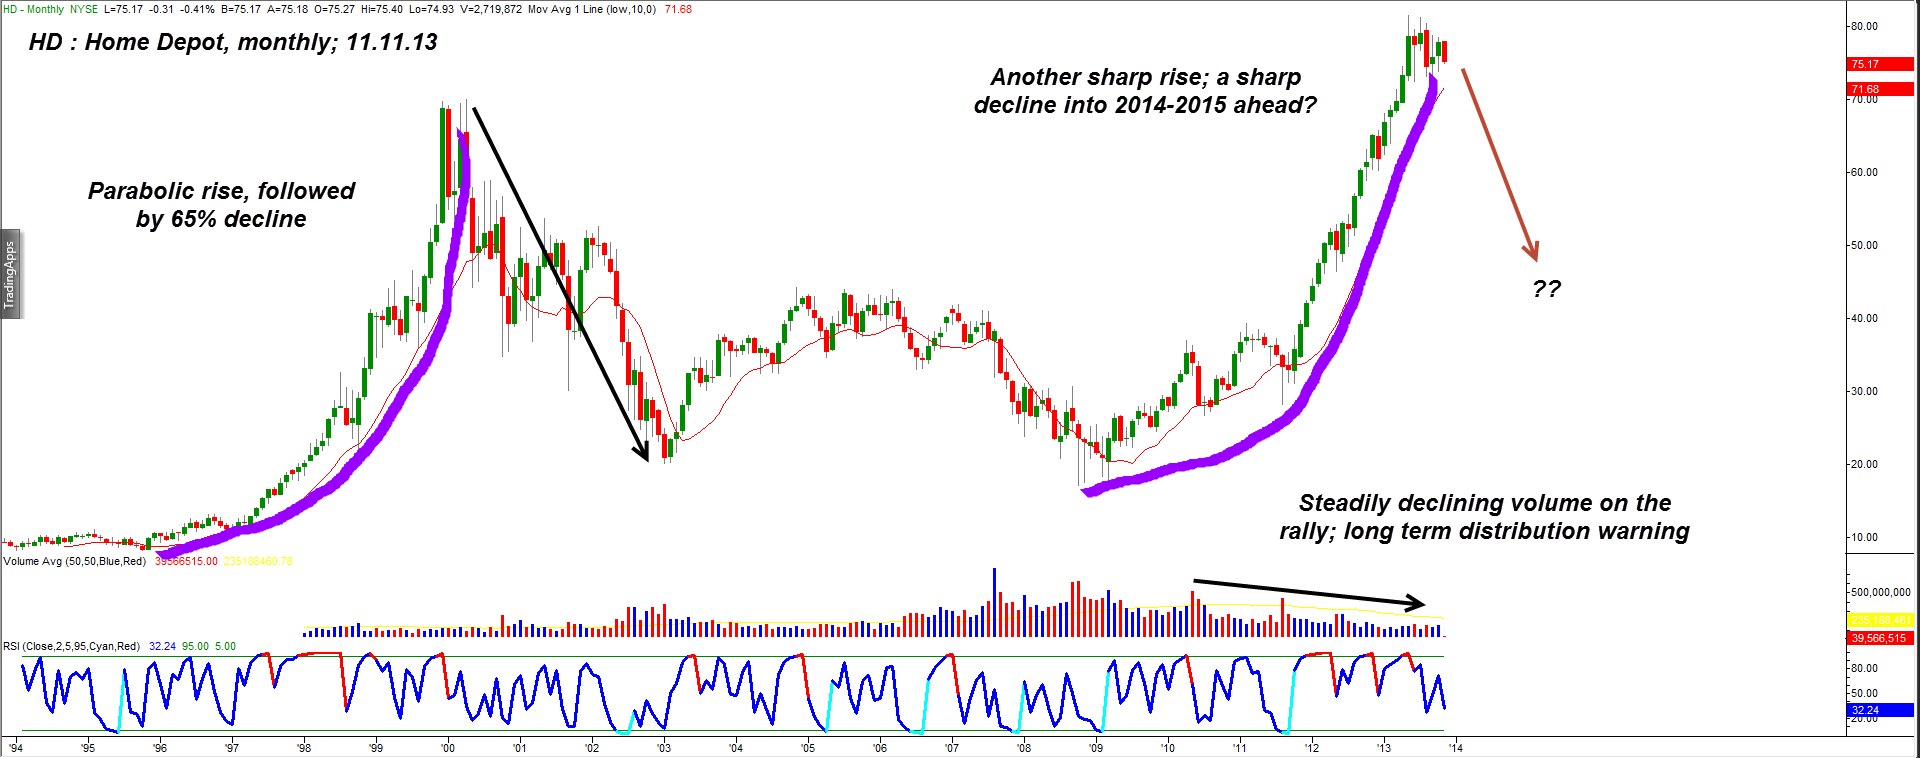
| Since making a multiyear bull market high on May 22, 2013, shares of Home Depot (HD) have been tracing out a large consolidation pattern as the stock continues to be drawn back down to its 200-day simple moving average (SMA). HD is once again getting close to a possible buy zone down near this key long term average and may soon offer traders an attractive, low-risk long entry. Here's a closer look (Figure 1). |

|
| Figure 1. Home Depot's (HD) latest monthly chart reveals some similarity to a previous parabolic run-up in the late 90s; a pullback to the 10-month simple moving average near 71.70 appears to be a high probability event as 2013 closes. |
| Graphic provided by: TradeStation. |
| |
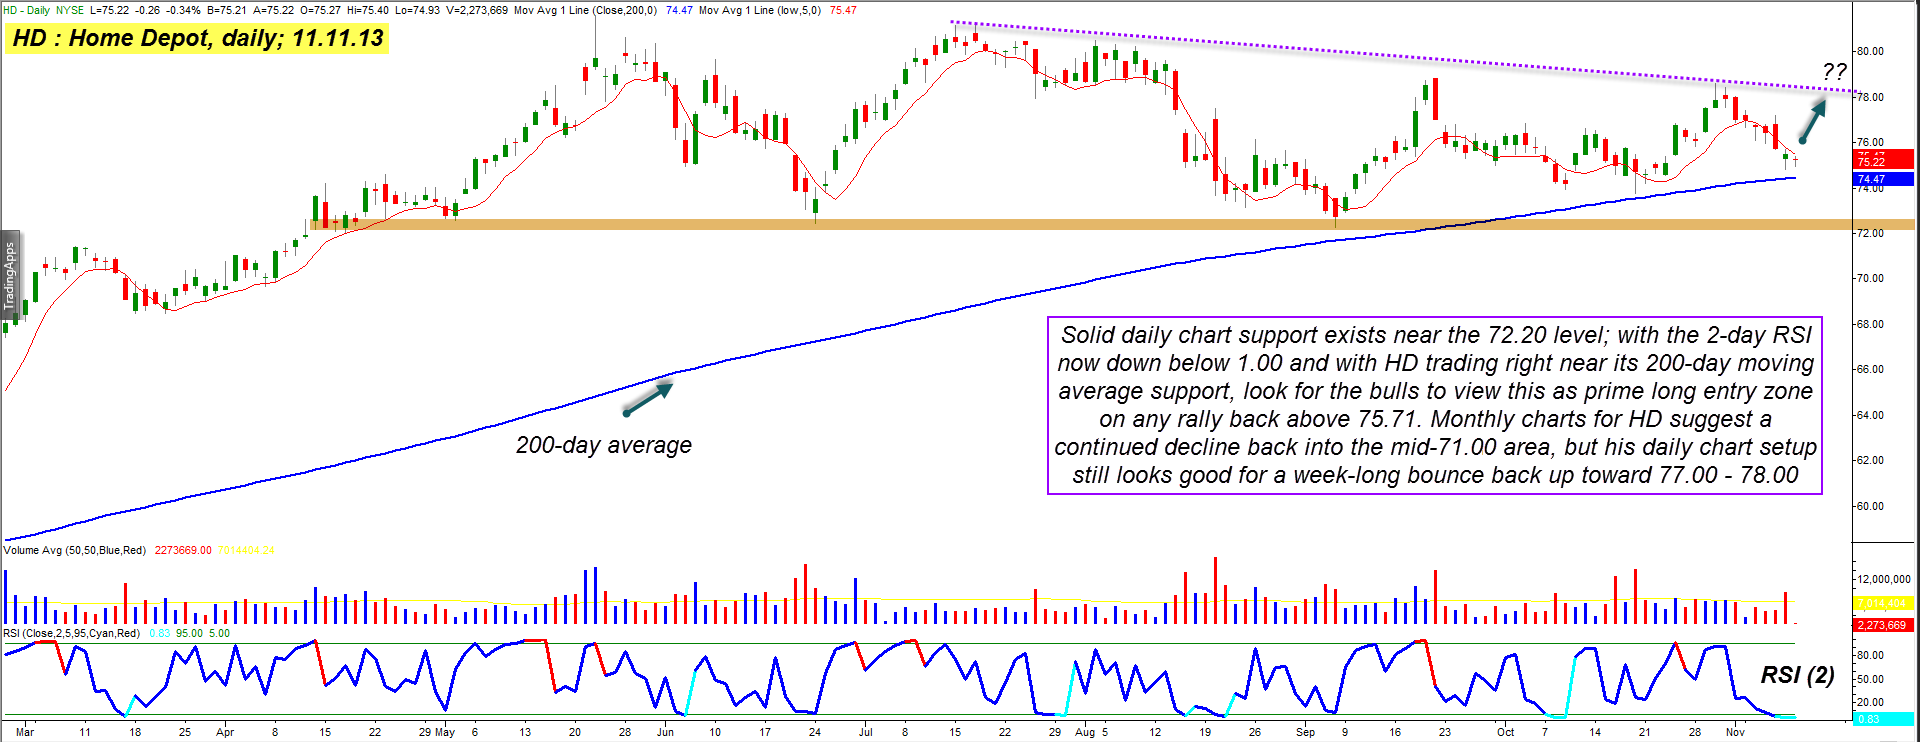
| HD has been one of the best long-term performers in the Dow 30 ever since it made a generational low back in October 2008; from that low of 17.05, the stock eventually ran all the way up to 81.56 on May 22, 2013, a gain of more than 375% in 60 months (that works out to 6.3% per month, on average). The stock's rally accelerated after pulling back to a multi-cycle low in August 2011, with HD managing to close higher in 20 of the 27 months that have since transpired. HD's monthly chart had been getting a bit "parabolic" however (not as bad as its prior massive run-up during 1997-1999, but still looking very "toppy" here) and its recent consolidation appears to be a much needed period of rest as the stock seeks another wave of buying power to attempt a move back above the May 2103 all-time highs. In fact, a move back down to test its 10-month simple moving average (near 71.68 or 5% below HD's current price) is well underway, and may be complete by late 2013/early 2014. In the near-term, however, swing traders look to have a good shot at getting on a decent daily chart bounce in HD, and here's why: 1. There is good daily chart support near the 72.20 area. 2. The two-day RSI indicator is deeply oversold, actually down below a value of 1.00 3. HD is trading just pennies above its all-important 200-day SMA. 4. As HD has enjoyed a massive, multiyear rally, pullbacks against the existing bullish trend are likely to be viewed by latecomers as a new long-term buying opportunity, making for a decent short-term bounce higher. This is shaping up to be an attractive risk/reward trade on the daily time frame; 77.31 is the closest meaningful resistance level and the daily low of November 8, 2013 is (74.78) the basic support level, meaning that the risk/reward level is about 1.5 to 1. |

|
| Figure 2: HD's daily chart, however, paints an image of a deeply oversold, large cap issue that may attract latecomers looking to ride yet another major move higher; it is these traders who may lay the foundation for shorter term swing traders to turn a quick profit. |
| Graphic provided by: TradeStation. |
| |
| Playing HD here is easy: 1. On a rise above 75.71 sell a December '13 HD $72.50 put option; this put has strong open interest of 2,889 and a bid-ask spread of only two cents; daily time decay (theta) is $2 per day/per contract and will accelerate the closer the put gets to December options expiration. 2. Using the 200-day moving average as your initial stop loss, hold the short put position until HD reaches the profit target of 77.19 or if the option loses 50 to 60% of its value or if it increases in value by 80, or HD drops back below its 200-day average. Finally, remember to risk no more than 1% of your account value on the trade and be prepared to take partial profits on the first good daily bounce higher, especially if the major US stock indexes aren't showing signs of strength (as measured by the advance-decline and up volume/down volume readings on the NYSE). Trade wisely until we meet here again. |
Freelance financial markets writer and online publisher of the Trendzetterz.com S&P 500 Weekly Forecast service.
| Title: | Market consultant and writer |
| Company: | Trendzetterz |
| Address: | 81 Hickory Hollow Drive |
| Crossville, TN 38555 | |
| Phone # for sales: | 904-303-4814 |
| Website: | trendzetterz.com |
| E-mail address: | support@trendzetterz.com |
Traders' Resource Links | |
| Trendzetterz has not added any product or service information to TRADERS' RESOURCE. | |
Click here for more information about our publications!
Comments

Request Information From Our Sponsors
- StockCharts.com, Inc.
- Candle Patterns
- Candlestick Charting Explained
- Intermarket Technical Analysis
- John Murphy on Chart Analysis
- John Murphy's Chart Pattern Recognition
- John Murphy's Market Message
- MurphyExplainsMarketAnalysis-Intermarket Analysis
- MurphyExplainsMarketAnalysis-Visual Analysis
- StockCharts.com
- Technical Analysis of the Financial Markets
- The Visual Investor
- VectorVest, Inc.
- Executive Premier Workshop
- One-Day Options Course
- OptionsPro
- Retirement Income Workshop
- Sure-Fire Trading Systems (VectorVest, Inc.)
- Trading as a Business Workshop
- VectorVest 7 EOD
- VectorVest 7 RealTime/IntraDay
- VectorVest AutoTester
- VectorVest Educational Services
- VectorVest OnLine
- VectorVest Options Analyzer
- VectorVest ProGraphics v6.0
- VectorVest ProTrader 7
- VectorVest RealTime Derby Tool
- VectorVest Simulator
- VectorVest Variator
- VectorVest Watchdog
