HOT TOPICS LIST
- MACD
- Fibonacci
- RSI
- Gann
- ADXR
- Stochastics
- Volume
- Triangles
- Futures
- Cycles
- Volatility
- ZIGZAG
- MESA
- Retracement
- Aroon
INDICATORS LIST
LIST OF TOPICS
PRINT THIS ARTICLE
by Koos van der Merwe
Here's a company that is saying "buy me" when the overall market looks weak.
Position: N/A
Koos van der Merwe
Has been a technical analyst since 1969, and has worked as a futures and options trader with First Financial Futures in Johannesburg, South Africa.
PRINT THIS ARTICLE
ELLIOTT WAVE
EI DuPont de Nemours & Co.
11/11/13 04:32:22 PMby Koos van der Merwe
Here's a company that is saying "buy me" when the overall market looks weak.
Position: N/A
| We all know that the best time to buy a stock is when everyone out there is selling. This past week, the Dow did look as though it was in a correction, and let's face it, even "Dr. Doom", Nouriel Roubini, known for accurately predicting in September 2006 that the real estate bubble would burst, has called for a strong market correction. So, when the market corrects, what do you buy? DD is one share that you should keep on your watch list. |

|
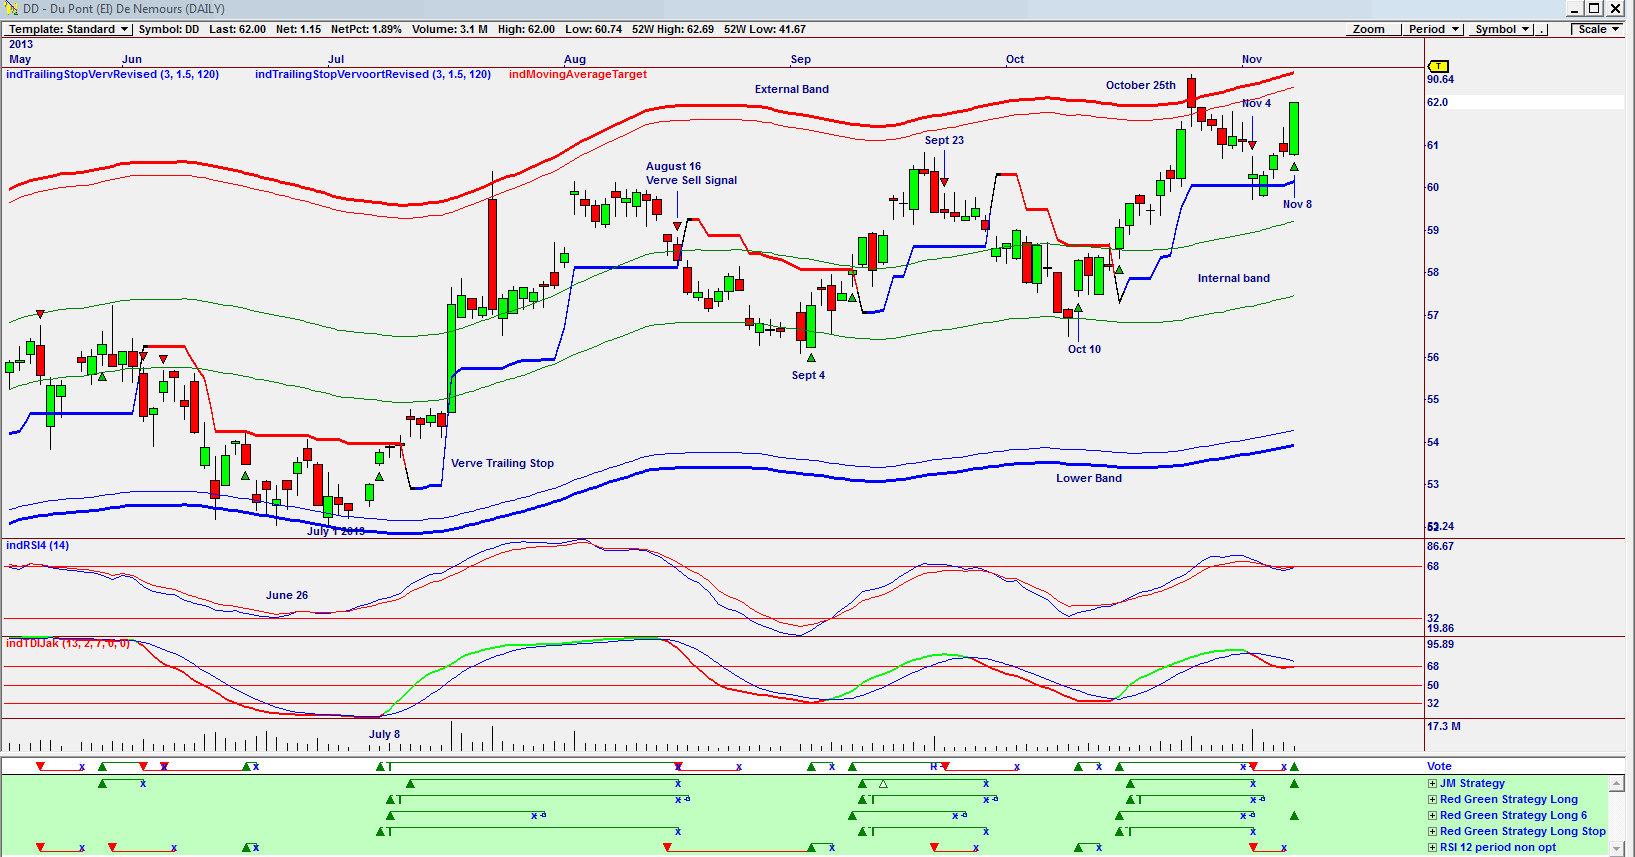
| Figure 1. Omnitrader DAILY chart of DD suggesting a VOTE line BUY signal. |
| Graphic provided by: Omnitrader. |
| |
| The chart in Figure 1 is an Omnitrader chart that has given a buy signal on the vote line based on the JM Strategy and the Red Green Strategy Long 6 shown in green below the Vote line. On July 1, 2013 the share price flirted with the lower band, suggesting that a buy signal was in the offing. The Vote line gave a buy signal on July 8, 2013, the same date that the TDIJak indicator gave a buy signal. The RSI gave a buy signal on June 26, 2013. All the signals would have been profitable with a sell signal given when the price broke below the Verve trailing stop on August 16, 2013. A fresh buy signal was given on September 4, 2013 as the price played with the lower internal band line. Another rise, with a Vote line sell based on the 12-period RSI non opt strategy was given on September 23, 2013. On October 10, 2013 a buy signal based on all the strategies shown in green below the vote line was followed by a sell signal on November 4, 2013 after the share price hit the upper band on October 25, 2013. On November 8, 2013 a buy signal was given based on the JM strategy and the Red Green Long 6 strategy, both shown in the green area below the vote line. The RSI indicator is above the 68 level, and the TDIJak indicator has not given a buy. |

|
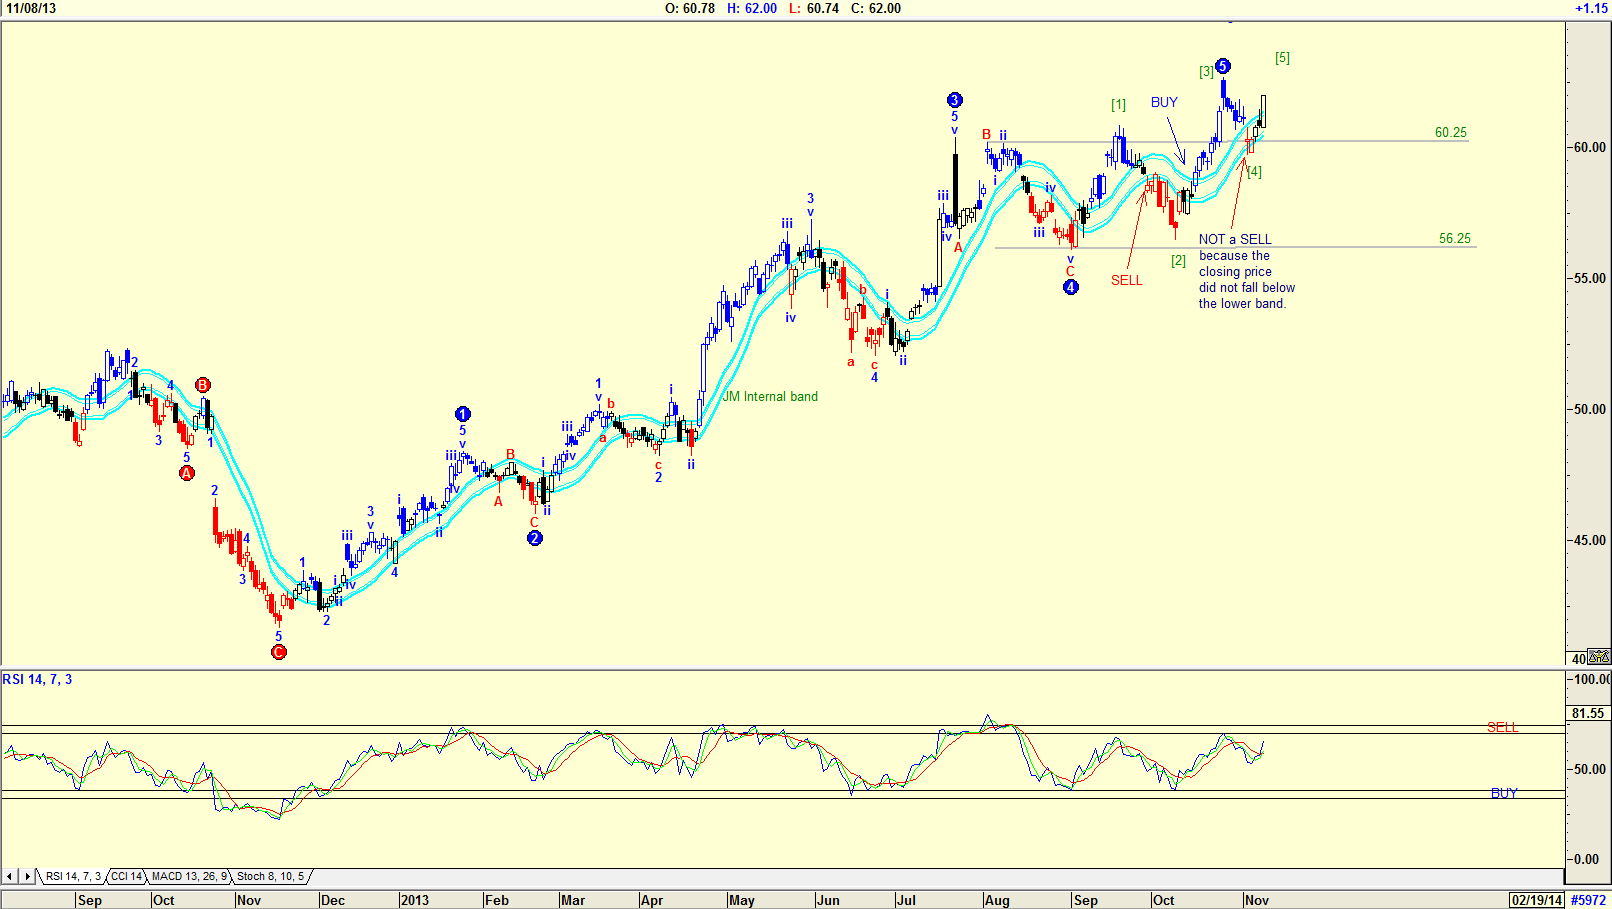
| Figure 2. Elliott Wave count for DD. |
| Graphic provided by: AdvancedGET. |
| |
| The chart in Figure 2 is an Elliott Wave count of DD, and suggests that the share price has completed a WAVE 5 and should correct somewhere between $60.25 and $56.25, the 4th wave of lesser degree. Note that the RSI indicator has not given a sell signal, suggesting that the price could go higher. The WAVE 5 shown on the chart also does not look correct, and is suggesting that an alternate count shown in brackets is a strong possibility. The price is currently also in a JM Internal Band buy. A JM Internal Band is a 15-period simple moving average offset by 2% positive and 2% negative. A break above the upper band is a buy and a move below the lower band is a sell. I would not be a buyer of DD at the present level, but would wait for a more definite Elliott Wave count with an RSI below the 32 level and giving a buy. This share is on my watch list. |
Has been a technical analyst since 1969, and has worked as a futures and options trader with First Financial Futures in Johannesburg, South Africa.
| Address: | 3256 West 24th Ave |
| Vancouver, BC | |
| Phone # for sales: | 6042634214 |
| E-mail address: | petroosp@gmail.com |
Click here for more information about our publications!
PRINT THIS ARTICLE

Request Information From Our Sponsors
- StockCharts.com, Inc.
- Candle Patterns
- Candlestick Charting Explained
- Intermarket Technical Analysis
- John Murphy on Chart Analysis
- John Murphy's Chart Pattern Recognition
- John Murphy's Market Message
- MurphyExplainsMarketAnalysis-Intermarket Analysis
- MurphyExplainsMarketAnalysis-Visual Analysis
- StockCharts.com
- Technical Analysis of the Financial Markets
- The Visual Investor
- VectorVest, Inc.
- Executive Premier Workshop
- One-Day Options Course
- OptionsPro
- Retirement Income Workshop
- Sure-Fire Trading Systems (VectorVest, Inc.)
- Trading as a Business Workshop
- VectorVest 7 EOD
- VectorVest 7 RealTime/IntraDay
- VectorVest AutoTester
- VectorVest Educational Services
- VectorVest OnLine
- VectorVest Options Analyzer
- VectorVest ProGraphics v6.0
- VectorVest ProTrader 7
- VectorVest RealTime Derby Tool
- VectorVest Simulator
- VectorVest Variator
- VectorVest Watchdog
