

HOT TOPICS LIST
- MACD
- Fibonacci
- RSI
- Gann
- ADXR
- Stochastics
- Volume
- Triangles
- Futures
- Cycles
- Volatility
- ZIGZAG
- MESA
- Retracement
- Aroon
INDICATORS LIST
LIST OF TOPICS
PRINT THIS ARTICLE
by Donald W. Pendergast, Jr.
After experiencing such an astounding 56-month long bull market, is the Dow 30 ready to make a major bearish turn?
Position: N/A
Donald W. Pendergast, Jr.
Freelance financial markets writer and online publisher of the Trendzetterz.com S&P 500 Weekly Forecast service.
PRINT THIS ARTICLE
REVERSAL
DIA: Bearish Reversal Already Underway?
11/11/13 04:27:28 PMby Donald W. Pendergast, Jr.
After experiencing such an astounding 56-month long bull market, is the Dow 30 ready to make a major bearish turn?
Position: N/A
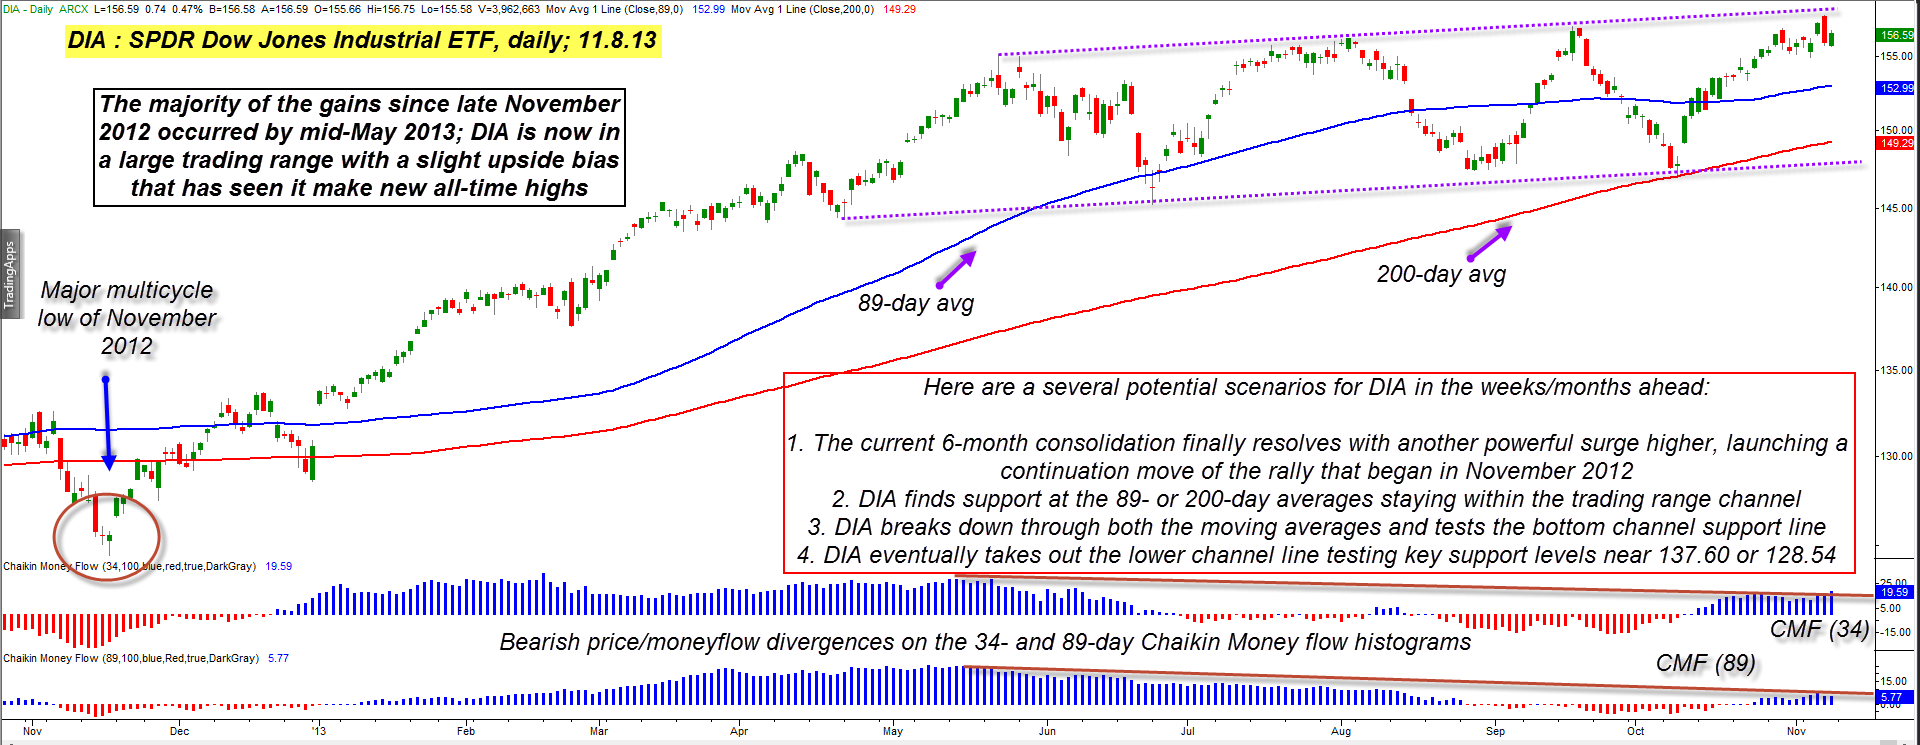
| The super bull market in the Dow 30 index (.DJIA, DIA) since March 2009 has moved upward in three major phases: 1. March 2009-April 2010 2. July 2010-May 2011 3. October 2011-present The third (current) rally phase is actually composed of three smaller bullish phases, with the latest one (November 2012-present) having the highest percentage gain and longest duration. The DIA has also made numerous new all-time highs since March 2013, further confirming the long-term staying power of this key US stock index. Certainly, a powerful long-term trend such as this one needs to be given every benefit of the doubt, but there are several interesting technical clues contained on DIA's daily chart in Figure 1 that offer some idea on where this ETF may be headed next. Here's a closer look. |
|
| Figure 1. Most of the gains made by DIA over the past 12 months occurred in the first six months after it made a major multi-cycle low in mid-November 2012. Money flow histograms depict significant bearish price/money flow divergences. |
| Graphic provided by: TradeStation. |
| |
| One of the first things that jumps out as you view DIA's daily chart is that most of the gains since last November were achieved during the first six months of the run higher; since mid-May 2013 the DIA has been contained within a wide trading range (purple lines) with a slight upward bias; clearly this market is either consolidating prior to a bullish continuation move or is topping out as a long-term price cycle (and there are several of those at work since March 2009, with some overdue for a decline) reaches its zenith prior to a downward reversal in prices. The DIA remains above its 89- and 200-day moving averages (with both averages sloping higher) but has also been oscillating around its 89-day average as it seeks to finally decide on what its next significant breakout move is likely to be. The medium- and long-term Chaikin Money flow histograms are confirming that major bearish divergences are well underway, and that would seem to be a mitigating factor that could hinder any sustained breakout above the upper channel line anytime soon. Last thursday's trading volume in DIA was heavy and given the wide-range reversal bar that originated right after DIA made a new all-time high, the probabilities may favor DIA dropping back toward the 89- or 200-day averages sometime in November/December 2013. Buying new highs is always a bit risky, especially when major bearish price/momentum or price/money flow divergences are present, so the bulls might do well to wait for a tradable pullback to the 89-day average before jumping back in here on the long side. |
|
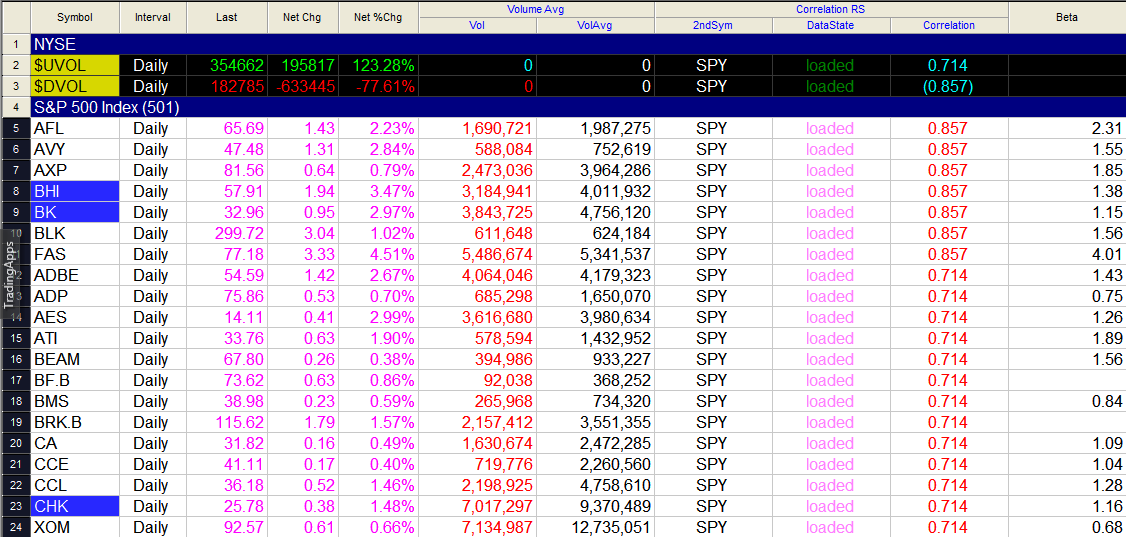
| Figure 2. A list of the stocks in the S&P 500 index (.SPX) that have the highest 14-day correlation with SPY. |
| Graphic provided by: TradeStation. |
| Graphic provided by: TradeStation RadarScreen. |
| |
| Here are the main scenarios that may play out in light of the technical patterns/dynamics at work on DIA's daily chart now. 1. The current six-month consolidation finally resolves with another powerful surge higher, launching a continuation move of the rally that began in November 2012. 2. DIA finds support at the 89- or 200-day averages staying within the trading range channel. 3. DIA breaks down through the moving averages and tests the bottom channel support line. 4. DIA eventually takes out the lower channel line testing key support levels near 137.60 or 128.54. The first scenario has the lowest probability of all at present, while the second and third ones appear to be the most probable near-term outcomes. The fourth scenario implies the onset of a major bear market, one that could last for a year or even more; only time will tell if that outcome will actually play out. If you're long the Dow 30 stocks now, be sure you have either a put option protection or trailing stop strategy in place and be aware of the major chart support/resistance areas depicted on the chart in Figure 1. Trade wisely until we meet here again. |
Freelance financial markets writer and online publisher of the Trendzetterz.com S&P 500 Weekly Forecast service.
| Title: | Market consultant and writer |
| Company: | Trendzetterz |
| Address: | 81 Hickory Hollow Drive |
| Crossville, TN 38555 | |
| Phone # for sales: | 904-303-4814 |
| Website: | trendzetterz.com |
| E-mail address: | support@trendzetterz.com |
Traders' Resource Links | |
| Trendzetterz has not added any product or service information to TRADERS' RESOURCE. | |
Click here for more information about our publications!
Comments

Request Information From Our Sponsors
- VectorVest, Inc.
- Executive Premier Workshop
- One-Day Options Course
- OptionsPro
- Retirement Income Workshop
- Sure-Fire Trading Systems (VectorVest, Inc.)
- Trading as a Business Workshop
- VectorVest 7 EOD
- VectorVest 7 RealTime/IntraDay
- VectorVest AutoTester
- VectorVest Educational Services
- VectorVest OnLine
- VectorVest Options Analyzer
- VectorVest ProGraphics v6.0
- VectorVest ProTrader 7
- VectorVest RealTime Derby Tool
- VectorVest Simulator
- VectorVest Variator
- VectorVest Watchdog
- StockCharts.com, Inc.
- Candle Patterns
- Candlestick Charting Explained
- Intermarket Technical Analysis
- John Murphy on Chart Analysis
- John Murphy's Chart Pattern Recognition
- John Murphy's Market Message
- MurphyExplainsMarketAnalysis-Intermarket Analysis
- MurphyExplainsMarketAnalysis-Visual Analysis
- StockCharts.com
- Technical Analysis of the Financial Markets
- The Visual Investor