HOT TOPICS LIST
- MACD
- Fibonacci
- RSI
- Gann
- ADXR
- Stochastics
- Volume
- Triangles
- Futures
- Cycles
- Volatility
- ZIGZAG
- MESA
- Retracement
- Aroon
INDICATORS LIST
LIST OF TOPICS
PRINT THIS ARTICLE
by Billy Williams
Lots of traders think Tesla's best days are behind it, but perhaps its biggest move may be underway.
Position: Buy
Billy Williams
Billy Williams has been trading the markets for 27 years, specializing in momentum trading with stocks and options.
PRINT THIS ARTICLE
STOCKS
Tesla's Next Big Move Underway
11/08/13 04:02:23 PMby Billy Williams
Lots of traders think Tesla's best days are behind it, but perhaps its biggest move may be underway.
Position: Buy
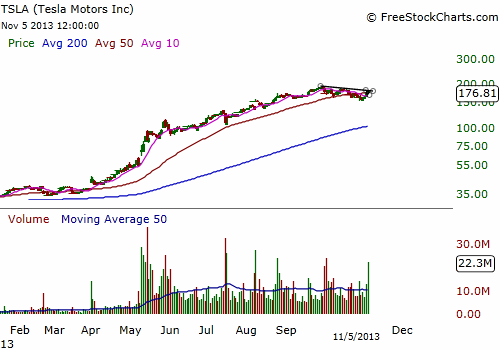
| Tesla Motors (TSLA), an auto company that specializes in electric powered cars, has been in the news lately as demand for its products and services have found a sweet spot among consumers. The stock has soared since April 1, 2013, after breaking out from a first stage base pattern, and has racked up just short of 400%. Lately, the stock has faltered, which has caused financial pundits and traders to question whether TSLA was a flash-in-the-pan stock whose 15-minutes of fame has come and gone. But, today, a new development is indicating that the bull run is about to resume and the best is yet to come for this future stock leader. TSLA is based out of California and designs, develops, manufactures, and sells electric vehicles. The company also provides services for the development of electric powertrain systems and components, and sells electric powertrain components to other automotive manufacturers. Currently, it owns about 42 dealerships throughout the U.S. and Canada. |

|
| Figure 1. TSLA has been on a strong bull run since Spring and seen a strong rise in its volume indicating accumulation is taking place. However, the stock has faltered and declined a bit over the summer. |
| Graphic provided by: www.freestockcharts.com. |
| |
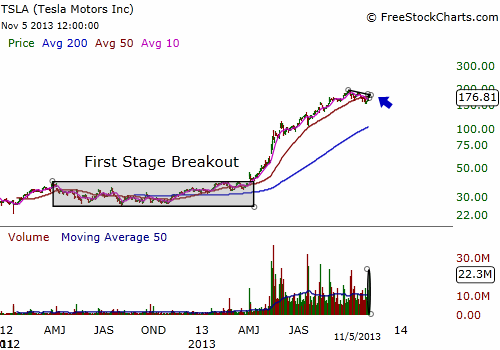
| The company went public in June of 2010 after which the stock's performance was relatively unremarkable — as most IPO's are in the beginning. Soon afterward, the stock found support as volume began to increase due to institutional and retail investors taking notice of the company's expansion. To date, the stock is still under accumulation and volume continues to rise. The stock went on to form a first stage base pattern, which typically acts as a launch point for stocks about to break out to higher ground, and take position as a stock leader in the market. From March 2012 to April 2013, TSLA entered a period of price contraction and traded range bound, which became the basis for the base pattern. From December 2012 to February 2013, TSLA's price action slowly inched up to the resistance point of its base pattern, at the $38 to $39 price level. On April 1, 2013, TSLA broke higher on volume of 700% over its 50-day average daily volume, a huge indicator that the stock was about to embark on a huge run to the upside. |

|
| Figure 2. TSLA formed its first stage base pattern for more than a year before breaking out in April of this year. After a huge run of almost 400%, is TSLA on a permanent decline or is it about to runaway and lead the stock market higher? |
| Graphic provided by: www.freestockcharts.com. |
| |
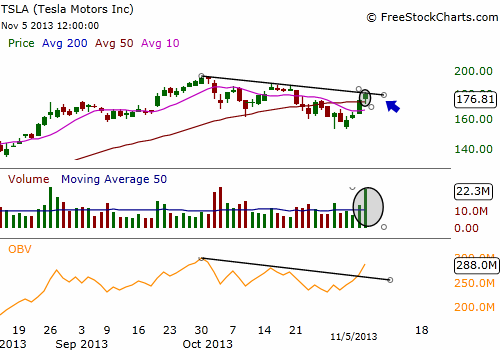
| Price gapped up on the day of its breakout where you could have entered or waited for price to pull back. Huge gaps on a breakout will typically offer a low-risk entry after the initial breakout, which TSLA did, and offer you the opportunity to take a position rather than chase the price after the breakout. The stock has been on a mad sprint to the upside and has gathered a strong following as a result, but the stock faltered during the summer and formed an inverse head & shoulders pattern, signaling a potential reversal of the trend and scared traders out of their positions. As a result, the stock has been declining but on November 5, 2013 triggered a new entry that reveals the stock may be ready to resume its trend. |

|
| Figure 3. TSLA fired off a pocket pivot entry on higher volume on November 5, 2013. Volume is continuing to show accumulation underway from the OBV's reading. TSLA's next price move up could be its biggest yet. |
| Graphic provided by: www.freestockcharts.com. |
| |
| The initial breakout out of a first stage base pattern is referred to as a first stage bull run and can be profitable when timed right, but can be risky if the breakout fails. However, after the stock corrects, the next move from this point of price correction can be the real "meat" of the move and is worth your attention. TSLA has fired a pocket pivot entry as price closed over the 50-day SMA on volume that was higher than the volume of the previous 10 trading days and, more importantly, higher than any down volume day. |
| Enter the stock with a stop of not more than 7% of your total position and ride the stock's price back up through its former price high. If the stock is not profitable 10 days from now, then exit the position and wait for another low-risk opportunity unless TSLA declines below the low point of its correction. |
Billy Williams has been trading the markets for 27 years, specializing in momentum trading with stocks and options.
| Company: | StockOptionSystem.com |
| E-mail address: | stockoptionsystem.com@gmail.com |
Traders' Resource Links | |
| StockOptionSystem.com has not added any product or service information to TRADERS' RESOURCE. | |
Click here for more information about our publications!
PRINT THIS ARTICLE

Request Information From Our Sponsors
- StockCharts.com, Inc.
- Candle Patterns
- Candlestick Charting Explained
- Intermarket Technical Analysis
- John Murphy on Chart Analysis
- John Murphy's Chart Pattern Recognition
- John Murphy's Market Message
- MurphyExplainsMarketAnalysis-Intermarket Analysis
- MurphyExplainsMarketAnalysis-Visual Analysis
- StockCharts.com
- Technical Analysis of the Financial Markets
- The Visual Investor
- VectorVest, Inc.
- Executive Premier Workshop
- One-Day Options Course
- OptionsPro
- Retirement Income Workshop
- Sure-Fire Trading Systems (VectorVest, Inc.)
- Trading as a Business Workshop
- VectorVest 7 EOD
- VectorVest 7 RealTime/IntraDay
- VectorVest AutoTester
- VectorVest Educational Services
- VectorVest OnLine
- VectorVest Options Analyzer
- VectorVest ProGraphics v6.0
- VectorVest ProTrader 7
- VectorVest RealTime Derby Tool
- VectorVest Simulator
- VectorVest Variator
- VectorVest Watchdog
