

HOT TOPICS LIST
- MACD
- Fibonacci
- RSI
- Gann
- ADXR
- Stochastics
- Volume
- Triangles
- Futures
- Cycles
- Volatility
- ZIGZAG
- MESA
- Retracement
- Aroon
INDICATORS LIST
LIST OF TOPICS
PRINT THIS ARTICLE
by Donald W. Pendergast, Jr.
Shares of Direxion Daily Financial Bear 3x Shares are beginning a bullish breakout as the financial sector stocks begin a pullback to support levels.
Position: N/A
Donald W. Pendergast, Jr.
Freelance financial markets writer and online publisher of the Trendzetterz.com S&P 500 Weekly Forecast service.
PRINT THIS ARTICLE
TECHNICAL ANALYSIS
FAZ: Rising As Financials Decline
11/07/13 04:31:21 PMby Donald W. Pendergast, Jr.
Shares of Direxion Daily Financial Bear 3x Shares are beginning a bullish breakout as the financial sector stocks begin a pullback to support levels.
Position: N/A
| Leveraged exchange-traded funds (ETFs) offer skilled traders the potential for outsized gains even as they offer inexperienced, foolish traders the chance to decimate their pool of risk capital — in record time, no less. Traders in the former category might do well to check out this emerging bullish breakout in Direxion Daily Financial Bear 3x Shares (FAZ). Here's a closer look, using the FAZ daily chart (Figure 1). |
|
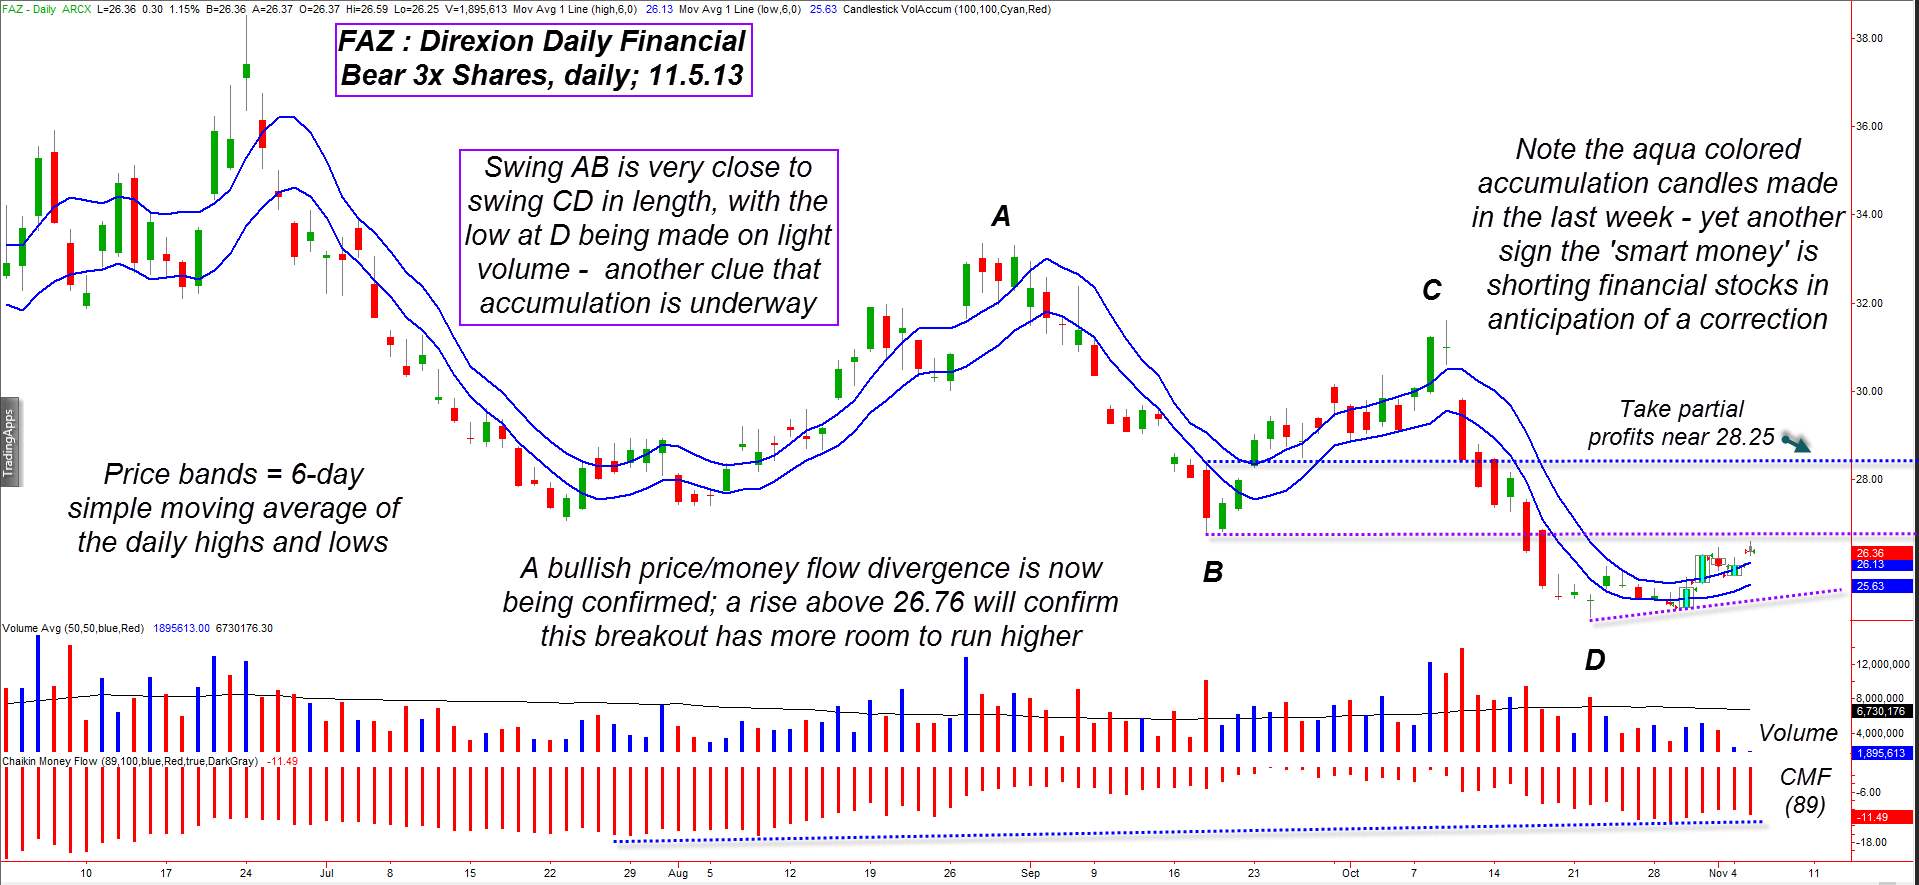
| Figure 1. A variety of time/price, money flow and momentum dynamics are suggesting that FAZ may be near the early stages of a profitable bullish swing move. |
| Graphic provided by: TradeStation. |
| |
| FAZ made its last multicycle high (remember this is an inverse, leveraged fund, so financial sector stock cycle lows are actually cycle highs for FAZ) on October 9, 2013 at a price of 31.61; only two weeks later, FAZ had plummeted by more than 21% as the financials surged higher along with the major US stock indexes. Lately, FAZ has been moving in very smooth cyclical thrusts, the kind that a simple moving average price channel system can easily profit from; the averages are the simple variety (SMA) and use the six-day highs and lows to create the bands. Breaks above the previous session's top band value trigger a long, with subsequent breaks below the previous day's bottom band value triggering a move back into cash. Right now, this system is already in a long position in FAZ, having gone long at 25.66 on October 30, 2013, and still shows an open profit as of this writing. Glancing at the chart, you'll see numerous bullish technical dynamics that are suggesting that this hypothetical long entry may prove to be a decent winner: 1. Including the entry trigger price bar, three 'accumulation' candles have printed (aqua colored) 2. The 89-day Chaikin Money flow histogram (CMF)(89) had already confirmed a bullish price/money flow divergence. 3. Swing AB is approximately the same length as swing CD; unless it's a strong trend in play, most markets don't make more than two equal length swings lower without there being a decent relief rally soon afterward. Note also that the low at 'D' was also achieved on light volume, indicating that the sellers are done and that the "smart money" is building a new long position in FAZ. 4. Both moving average bands have turned higher, confirming the bullish momentum in this ETF. The next and final confirmation that FAZ is likely to embark on a profitable swing move will be if/when it clears the resistance line near 26.76; that can also be considered an "add-on" price zone for more aggressive traders. |
|
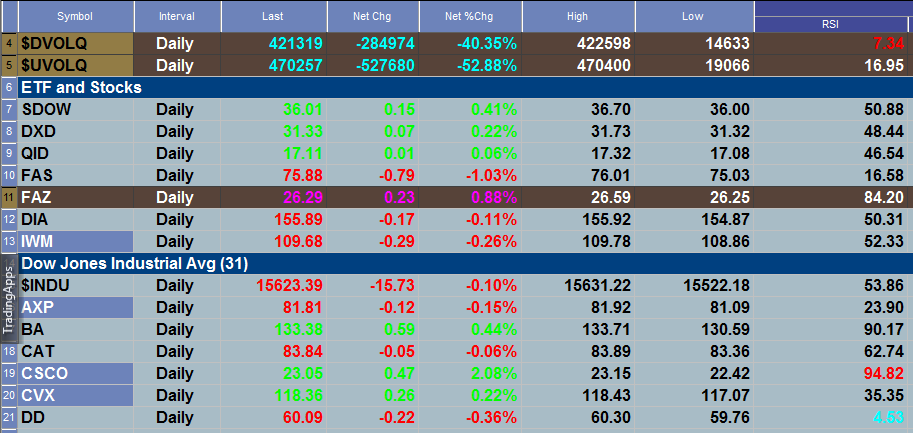
| Figure 2. FAZ trades higher at midday on Tuesday November 5, 2013; notice the overbought 2-day RSI on CSCO and the oversold 2-day RSI on DD. |
| Graphic provided by: TradeStation. |
| Graphic provided by: TradeStation RadarScreen. |
| |
| If/when the 26.76 level is cleared, the next significant resistance barrier for FAZ will be the 28.29 area (upper horizontal line), and given the volatile nature of triple-leveraged (3x) ETFs, it might be a wise move to take at least partial profits on this trade, letting the balance run with the lower moving average band as your trailing stop loss. Two other 3x leveraged US stock index ETFs are now pulling back to key support on their 60-minute charts (after staging powerful bullish gaps at Tuesday's open), so the anticipated bearish turn in the market may now be on the verge of launching in a meaningful way. However you decide to play the next bearish (bullish for FAZ) turn in the markets, remember to keep your per-trade risks small and be ready to take partial profits on each strong move toward key support levels along the way. Trade wisely until we meet here again. |
Freelance financial markets writer and online publisher of the Trendzetterz.com S&P 500 Weekly Forecast service.
| Title: | Market consultant and writer |
| Company: | Trendzetterz |
| Address: | 81 Hickory Hollow Drive |
| Crossville, TN 38555 | |
| Phone # for sales: | 904-303-4814 |
| Website: | trendzetterz.com |
| E-mail address: | support@trendzetterz.com |
Traders' Resource Links | |
| Trendzetterz has not added any product or service information to TRADERS' RESOURCE. | |
Click here for more information about our publications!
Comments
Date:�11/18/13Rank:�5Comment:�

Request Information From Our Sponsors
- StockCharts.com, Inc.
- Candle Patterns
- Candlestick Charting Explained
- Intermarket Technical Analysis
- John Murphy on Chart Analysis
- John Murphy's Chart Pattern Recognition
- John Murphy's Market Message
- MurphyExplainsMarketAnalysis-Intermarket Analysis
- MurphyExplainsMarketAnalysis-Visual Analysis
- StockCharts.com
- Technical Analysis of the Financial Markets
- The Visual Investor
- VectorVest, Inc.
- Executive Premier Workshop
- One-Day Options Course
- OptionsPro
- Retirement Income Workshop
- Sure-Fire Trading Systems (VectorVest, Inc.)
- Trading as a Business Workshop
- VectorVest 7 EOD
- VectorVest 7 RealTime/IntraDay
- VectorVest AutoTester
- VectorVest Educational Services
- VectorVest OnLine
- VectorVest Options Analyzer
- VectorVest ProGraphics v6.0
- VectorVest ProTrader 7
- VectorVest RealTime Derby Tool
- VectorVest Simulator
- VectorVest Variator
- VectorVest Watchdog