HOT TOPICS LIST
- MACD
- Fibonacci
- RSI
- Gann
- ADXR
- Stochastics
- Volume
- Triangles
- Futures
- Cycles
- Volatility
- ZIGZAG
- MESA
- Retracement
- Aroon
INDICATORS LIST
LIST OF TOPICS
PRINT THIS ARTICLE
by Koos van der Merwe
When a company becomes a take-over target, is it worth a buy or should you wait?
Position: Hold
Koos van der Merwe
Has been a technical analyst since 1969, and has worked as a futures and options trader with First Financial Futures in Johannesburg, South Africa.
PRINT THIS ARTICLE
ELLIOTT WAVE
Is Vodaphone Worth A Buy?
11/05/13 04:40:17 PMby Koos van der Merwe
When a company becomes a take-over target, is it worth a buy or should you wait?
Position: Hold
| Vodafone hit everyone's attention on news that AT&T may be interested in acquiring the company. AT&T is actively seeking a number of strategic acquisitions. However, Vodafone may have its own plan for expansion of its mobile technology coverage in over 30 countries. The AT&T deal may not be as trouble free as expected. AT&T, the second largest provider of cell phone service in the United States, has shown an interest in snapping up smaller wireless companies. It has spent the last year searching throughout Europe for likely candidates before settling on Vodafone. In July 2013, the company purchased Leap Wireless, but the deal has still not closed. |

|
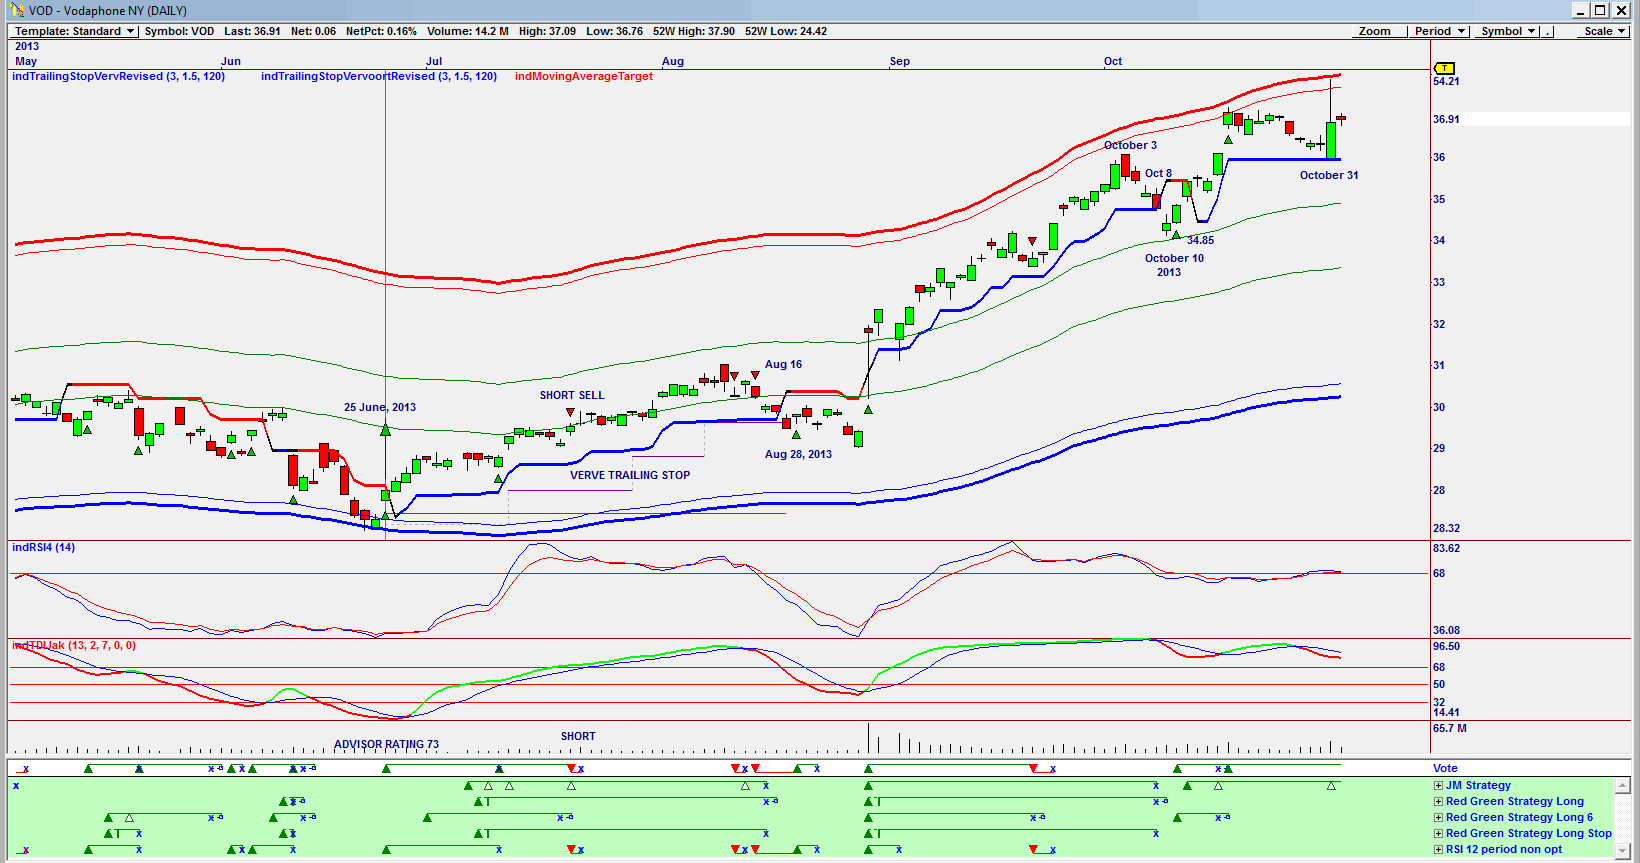
| Figure 1. Daily Omnitrader chart. |
| Graphic provided by: Omnitrader. |
| |
| The chart in Figure 1 is an Omnitrader chart with the VOTE line giving a buy signal on June 25, 2013. The are a number of short sell signals as shown on the chart, but the price only broke below the Verve Trailing Stop on August 16, 2013 and then gave a new buy signal on August 28, 2013. The price rose once again only breaking below the Verve trailing stop on October 8, 2013 and then gave a fresh buy signal on October 10, 2013. Although it tested the Verve trailing stop on October 31, 2013 it did not signal a sell. The Vote line is still suggesting a hold. Would I have bought the share on June 25, 2013? Definitely yes, because the share price was testing the bottom external band. The advisor rating was also 73, a strong rating. I would have also sold every time the Verve trailing stop was broken but would have bought with every new buy signal and would be holding even now. |

|
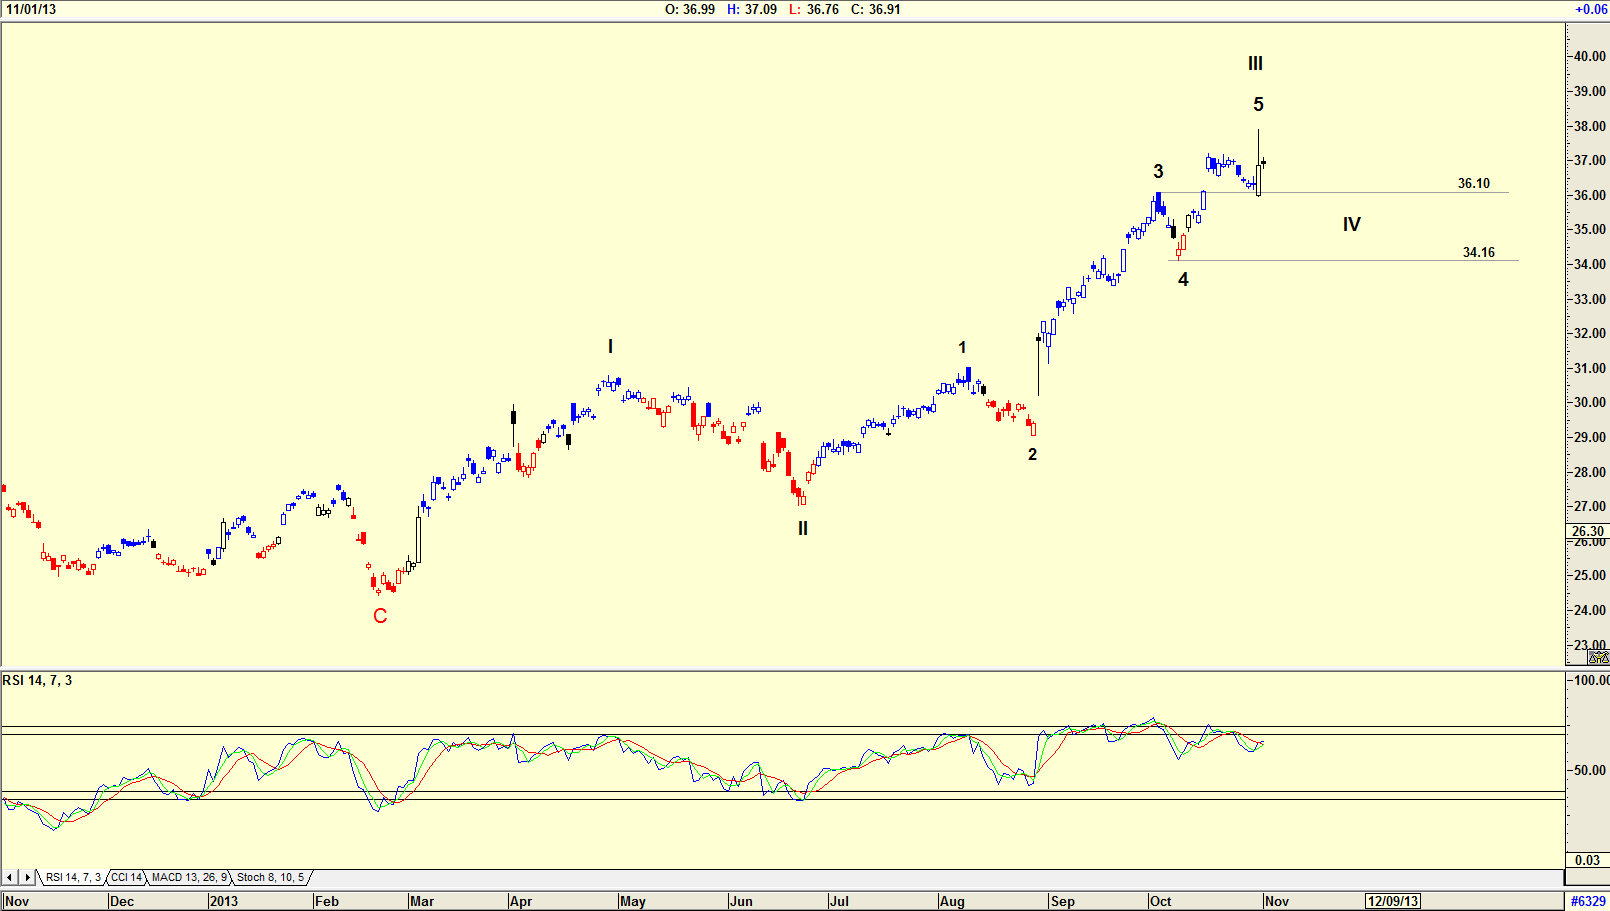
| Figure 2. Daily Elliott Wave count. |
| Graphic provided by: AdvancedGET. |
| |
| Looking at the chart in Figure 2 of Vodafone, an Elliott Wave count is suggesting that Vodafone is in a WAVE III with a WAVE IV that will retrace to somewhere between $36.10 and $34.16, the 4th Wave of lesser degree. The RSI indicator is at overbought levels, and is trending down. The chart is telling me not to buy at the moment, but to wait. The chart is suggesting that AT&T's purchase may not happen in the near future. That the chart in Figure 2 is suggesting a correction is on the cards means that AT&T may not find it easy to purchase Vodaphone, and may have to up their price. The chart is suggesting that I wait awhile before making a purchase. I will closely watch the RSI indicator, and look for a buy signal, if and when. |
Has been a technical analyst since 1969, and has worked as a futures and options trader with First Financial Futures in Johannesburg, South Africa.
| Address: | 3256 West 24th Ave |
| Vancouver, BC | |
| Phone # for sales: | 6042634214 |
| E-mail address: | petroosp@gmail.com |
Click here for more information about our publications!
PRINT THIS ARTICLE

Request Information From Our Sponsors
- StockCharts.com, Inc.
- Candle Patterns
- Candlestick Charting Explained
- Intermarket Technical Analysis
- John Murphy on Chart Analysis
- John Murphy's Chart Pattern Recognition
- John Murphy's Market Message
- MurphyExplainsMarketAnalysis-Intermarket Analysis
- MurphyExplainsMarketAnalysis-Visual Analysis
- StockCharts.com
- Technical Analysis of the Financial Markets
- The Visual Investor
- VectorVest, Inc.
- Executive Premier Workshop
- One-Day Options Course
- OptionsPro
- Retirement Income Workshop
- Sure-Fire Trading Systems (VectorVest, Inc.)
- Trading as a Business Workshop
- VectorVest 7 EOD
- VectorVest 7 RealTime/IntraDay
- VectorVest AutoTester
- VectorVest Educational Services
- VectorVest OnLine
- VectorVest Options Analyzer
- VectorVest ProGraphics v6.0
- VectorVest ProTrader 7
- VectorVest RealTime Derby Tool
- VectorVest Simulator
- VectorVest Variator
- VectorVest Watchdog
