

HOT TOPICS LIST
- MACD
- Fibonacci
- RSI
- Gann
- ADXR
- Stochastics
- Volume
- Triangles
- Futures
- Cycles
- Volatility
- ZIGZAG
- MESA
- Retracement
- Aroon
INDICATORS LIST
LIST OF TOPICS
PRINT THIS ARTICLE
by Billy Williams
Biogen Idec Inc. (BIIB) has a lot of things working for it to be a potential homerun, but here is why you should avoid this stock.
Position: Buy
Billy Williams
Billy Williams has been trading the markets for 27 years, specializing in momentum trading with stocks and options.
PRINT THIS ARTICLE
STOCKS
BIIB: Warning Signs, False Breakouts
11/04/13 04:30:29 PMby Billy Williams
Biogen Idec Inc. (BIIB) has a lot of things working for it to be a potential homerun, but here is why you should avoid this stock.
Position: Buy
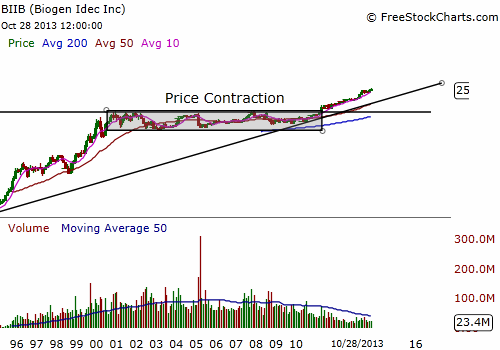
| The Medical-Biomed/Biotech Group has been one of the best performing industries in the stock market in recent years and currently ranks third among all industry groups that are actively trading. Advances in medicine, surgical equipment, and advanced sciences are common as modern technology makes it possible for doctors to provide better care and overall wellness for their patients. One of the leaders in that industry group, Biogen Idec Inc. (BIIB), one of the best performing big biotechs of 2013, reported solid third-quarter 2013 earnings but stalled near its all-time high despite increased volume of almost 160% of its 50-day average daily volume. This stalled price action begs the question on whether BIIB is preparing to breakout to higher ground, or if you should sit on the sidelines to wait and see what develops. BIIB discovers, develops, manufactures, and markets therapies for the treatment of neurodegenerative diseases, hemophilia, and autoimmune disorders in the United States and foreign markets. The stock has been trading upward on a long-term bullish trend most notably from early 1995 to 2001 where price stalled and the stock entered into a long period of price contraction where a trading range set in from $28 to $77. |
|
| Figure 1. Biogen has been in a long-term bullish trend but entered a decade-long period of price contraction before breaking out. Now, the stock has been in a firm uptrend while being a part of one of the strongest industry groups in today's stock market. |
| Graphic provided by: www.freestockcharts.com. |
| |
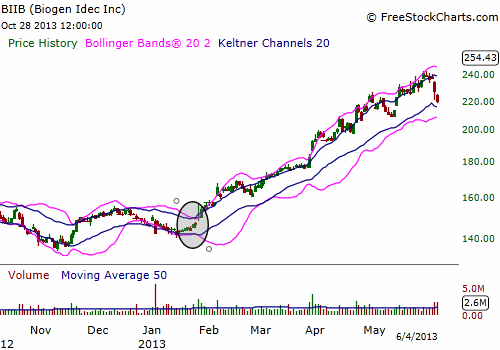
| This trading range developed into a long-term period of price contraction for almost a decade before the stock managed to breakout in late April 2011 and has been in a bull run ever since. Studying the long-term monthly price chart, you can easily see where price was trending steadily, where price contraction set in, and where price expansion followed. BIIB's technical action made it apparent that the trend was in effect once again and that it was time to scale down to a smaller time period, like the daily price chart, to look for low-risk entries. Earlier this year, in late January, BIIB offered a great low-risk entry as a squeeze setup occurred where the stock's Bollinger Bands traded within its Keltner Channels. Bollinger Bands display volatility averages based on the stock's price action while the Keltner Channels form bands based on the open, close, and daily range averages of the stock's price action. When the Bollinger Bands contract and enter the Keltner Channel's bands, it indicates that volatility is falling. Since volatility always reverts to its mean, it means that BIIB would eventually return to high volatility and explode in a given direction which it did on January 28, 2013. |
|
| Figure 2. Earlier this year, BIIB signaled a squeeze setup that triggered a long entry which led to a gain of just under 100 points before pulling back into a trading range. |
| Graphic provided by: www.freestockcharts.com. |
| |
| Price surged just under 100 points before falling back into a trading range which is where BIIB currently finds itself. BIIB's price action has been trading comfortably above its 200-day SMA which puts it firmly in bullish territory from a technical perspective but has lacked the power to breakout from the contracted price range where it currently sits. What is needed is a combination of explosive volume and strong price action to help it escape the gravity of the base pattern it is presently confined to. And, despite strong earnings and keeping company among the strongest stocks in its industry group, BIIB performance is lackluster at best for a potential runaway stock. |
|
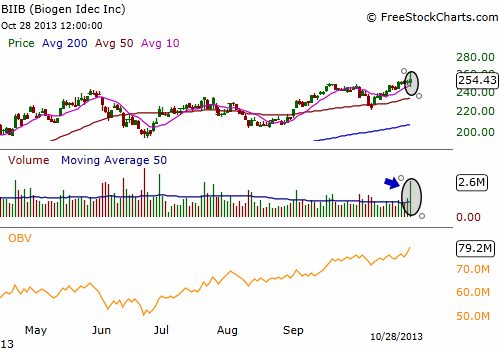
| Figure 3. The On Balance Volume Indicator shows that volume is rising in BIIB and on their latest earnings report, BIIB's trade volume swelled to over 160% of its normal volume but is it a good time to enter into the stock? |
| Graphic provided by: www.freestockcharts.com. |
| |
| Volume swelled to almost 160% of its 50-day average volume but the day's price action was seriously lacking. Unable to even close at the top of its daily trading range, BIIB didn't exactly instill confidence in traders that it would trade to higher ground. At this point, any entry into BIIB should get a firm pass and a sign to step aside and wait for the stock to prove itself worthy of a new long position. The stock certainly has a combination of positive factors in its favor such as trading at an all-time high, trading in a strong industry group, and positive volume. But if price and volume aren't in sync, then keep your powder dry until BIIB starts projecting more strength. Keep an eye on the stock and trade any explosive gap or bullish price action on higher volume but, for now, don't get sucked into a false breakout that has poor odds of success. |
Billy Williams has been trading the markets for 27 years, specializing in momentum trading with stocks and options.
| Company: | StockOptionSystem.com |
| E-mail address: | stockoptionsystem.com@gmail.com |
Traders' Resource Links | |
| StockOptionSystem.com has not added any product or service information to TRADERS' RESOURCE. | |
Click here for more information about our publications!
PRINT THIS ARTICLE

Request Information From Our Sponsors
- StockCharts.com, Inc.
- Candle Patterns
- Candlestick Charting Explained
- Intermarket Technical Analysis
- John Murphy on Chart Analysis
- John Murphy's Chart Pattern Recognition
- John Murphy's Market Message
- MurphyExplainsMarketAnalysis-Intermarket Analysis
- MurphyExplainsMarketAnalysis-Visual Analysis
- StockCharts.com
- Technical Analysis of the Financial Markets
- The Visual Investor
- VectorVest, Inc.
- Executive Premier Workshop
- One-Day Options Course
- OptionsPro
- Retirement Income Workshop
- Sure-Fire Trading Systems (VectorVest, Inc.)
- Trading as a Business Workshop
- VectorVest 7 EOD
- VectorVest 7 RealTime/IntraDay
- VectorVest AutoTester
- VectorVest Educational Services
- VectorVest OnLine
- VectorVest Options Analyzer
- VectorVest ProGraphics v6.0
- VectorVest ProTrader 7
- VectorVest RealTime Derby Tool
- VectorVest Simulator
- VectorVest Variator
- VectorVest Watchdog