

HOT TOPICS LIST
- MACD
- Fibonacci
- RSI
- Gann
- ADXR
- Stochastics
- Volume
- Triangles
- Futures
- Cycles
- Volatility
- ZIGZAG
- MESA
- Retracement
- Aroon
INDICATORS LIST
LIST OF TOPICS
PRINT THIS ARTICLE
by Donald W. Pendergast, Jr.
Shares of Apple Computer had risen more than 38% since this summer's lows, the giant reversal bar that just printed suggests that the party is over for now.
Position: N/A
Donald W. Pendergast, Jr.
Freelance financial markets writer and online publisher of the Trendzetterz.com S&P 500 Weekly Forecast service.
PRINT THIS ARTICLE
REVERSAL
AAPL: Bearish Turn
10/31/13 03:25:07 PMby Donald W. Pendergast, Jr.
Shares of Apple Computer had risen more than 38% since this summer's lows, the giant reversal bar that just printed suggests that the party is over for now.
Position: N/A
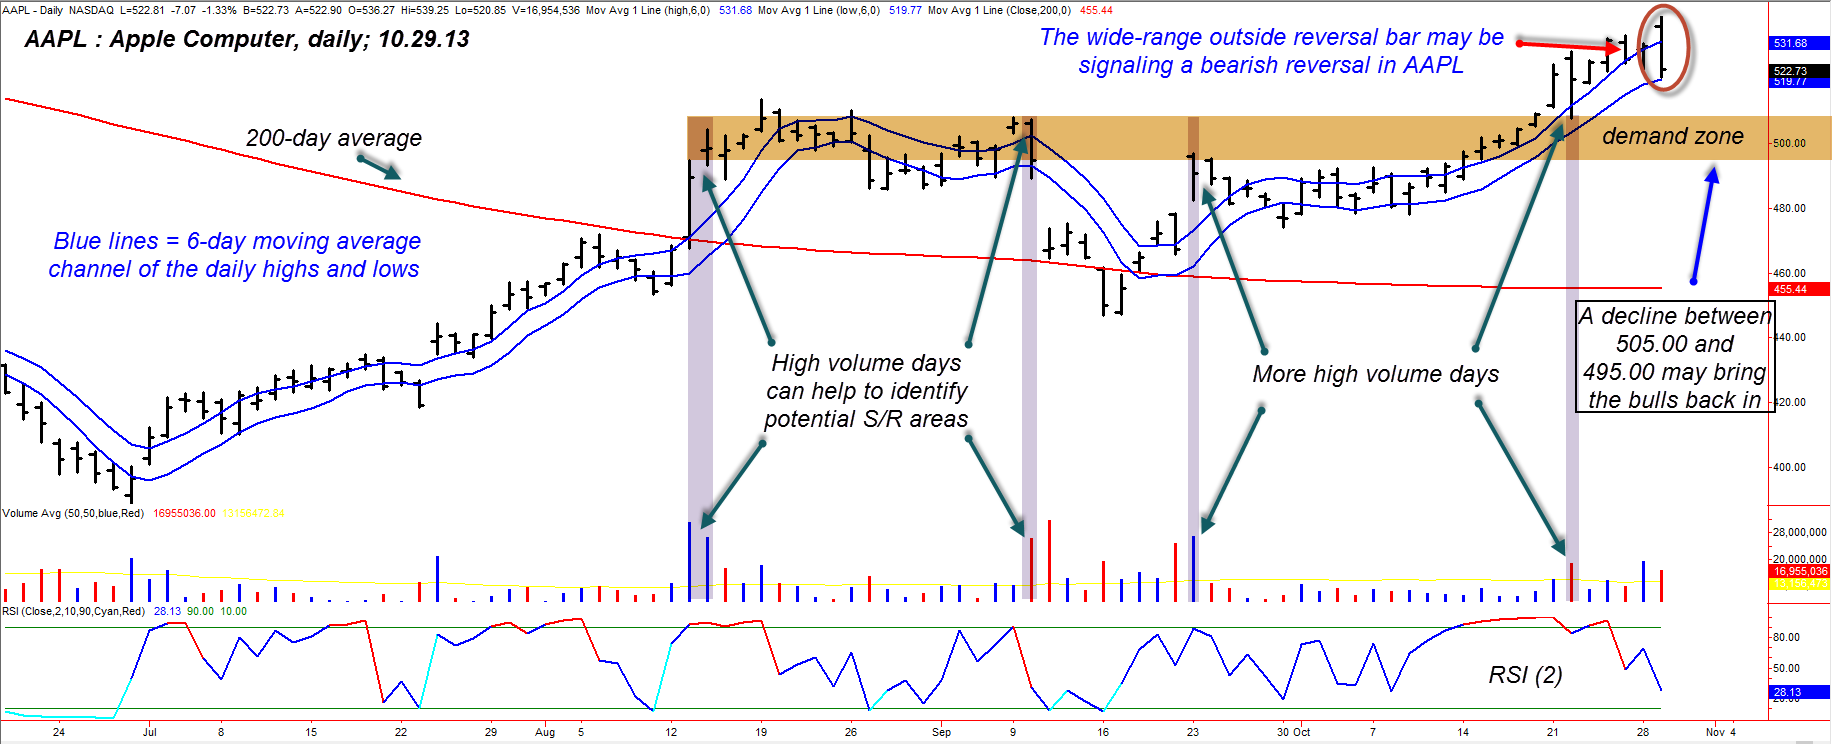
| After making a major multi-cycle low this summer, shares of Apple Computer (AAPL) staged a strong recovery for four months; not even a modest 5% Q3 earnings surprise was enough to keep the rally going into November 2013, however, and the stock has now "officially" begun to make a bearish reversal. Here's a closer look (Figure 1). |
|
| Figure 1. The wide-range bearish "outside" bar on October 29, 2013 may be the death-knell for AAPL's two-stage summer/fall rally; note that strong demand for the stock resides in the 495.00 to 505.00 area. |
| Graphic provided by: TradeStation. |
| |
| A year and a half ago, it almost seemed as if the 1998-2000 Nasdaq mania were playing out all over again in several big name stocks like Google (GOOG), Priceline.com (PCLN), and Apple Computer (AAPL); AAPL was in the midst of a powerful sustained surge from the mid-$300 area and eventually topped near $705 per share, and the stock was a favorite of retail and institutional traders alike. But the subsequent "crash" that dropped the stock back down to $388 proved once again that once the stock's price gets too far ahead of its fundamentals, a nasty correction is sometimes in the cards. Conversely, when a stock gets overly punished, driven to a value far below its true value, it's not too difficult to profit from an eventual rally. Well, AAPL was indeed driven far below "fair" value this past summer and traders/investors wasted little time loading back up on shares once it dipped below $400, pushing it back above its 200-day moving average once again. Long term, AAPL still appears to have room for more gains — perhaps even making it back above $600 during 2014 — but for the here and now it's looking like AAPL is ready to correct by at least 5 to 8% from its recent high of 539.25. Here's why: 1. The area between 539.00 and 550.00 is an area of overhead supply — simply meaning that there are plenty of short sellers and/or existing longs who see that as a temporary upper price limit for the stock. 2. On only 10 trading days did AAPL's long-term money flow histogram ever rise above its zeroline during the entire rally phase from late June 2013. The "smart" money crowd wasn't interested in building a sizable long-term position in AAPL. 3. The wide range, bearish, outside reversal bar that printed on October 29, 2013 — one occurring after a sustained rally — suggests that AAPL has a high probability of dipping back down into the "demand" zone between 495.00 and 505.00; notice the numerous high volume days that show where the "real" support/resistance areas are in the stock (gold shaded zone). 4. Finally, a "dumb-as-a-box-of rocks" trading system template has also triggered a new short signal in AAPL at 518.22 — the blue channel lines depict the six-day moving averages of the daily highs and lows, providing the framework for a simple trend following system. Traders may also consider entering a short trade if Tuesday's low of 514.54 is taken out, being sure to take at least half profits as soon as APPL dips into the gold "demand" zone. By no means should swing traders attempt to hold on for a move down below the 495.00 area as that area (and possibly the 500.00 area) could bring the bulls back in again, looking to catch a pullback entry for a fresh long. |
|
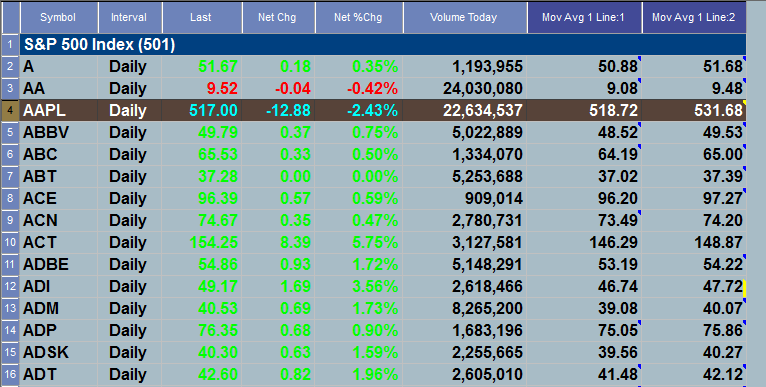
| Figure 2. AAPL crosses under its lower moving average channel line; if Tuesday's low of 514.54 is taken out within the next few sessions, expect a swift move lower into the demand zone shown on the daily price chart. |
| Graphic provided by: TradeStation. |
| Graphic provided by: TradeStation RadarScreen. |
| |
| The major US markets are highly vulnerable to a swift downside move within the next week or two; no one knows what the exact precipitating event will be, but just so you know, the "smart money" folks — just like Elvis — have apparently already left the building, so to speak. The more you know, so they say .... trade wisely until we meet here again. |
Freelance financial markets writer and online publisher of the Trendzetterz.com S&P 500 Weekly Forecast service.
| Title: | Market consultant and writer |
| Company: | Trendzetterz |
| Address: | 81 Hickory Hollow Drive |
| Crossville, TN 38555 | |
| Phone # for sales: | 904-303-4814 |
| Website: | trendzetterz.com |
| E-mail address: | support@trendzetterz.com |
Traders' Resource Links | |
| Trendzetterz has not added any product or service information to TRADERS' RESOURCE. | |
Click here for more information about our publications!
PRINT THIS ARTICLE

Request Information From Our Sponsors
- StockCharts.com, Inc.
- Candle Patterns
- Candlestick Charting Explained
- Intermarket Technical Analysis
- John Murphy on Chart Analysis
- John Murphy's Chart Pattern Recognition
- John Murphy's Market Message
- MurphyExplainsMarketAnalysis-Intermarket Analysis
- MurphyExplainsMarketAnalysis-Visual Analysis
- StockCharts.com
- Technical Analysis of the Financial Markets
- The Visual Investor
- VectorVest, Inc.
- Executive Premier Workshop
- One-Day Options Course
- OptionsPro
- Retirement Income Workshop
- Sure-Fire Trading Systems (VectorVest, Inc.)
- Trading as a Business Workshop
- VectorVest 7 EOD
- VectorVest 7 RealTime/IntraDay
- VectorVest AutoTester
- VectorVest Educational Services
- VectorVest OnLine
- VectorVest Options Analyzer
- VectorVest ProGraphics v6.0
- VectorVest ProTrader 7
- VectorVest RealTime Derby Tool
- VectorVest Simulator
- VectorVest Variator
- VectorVest Watchdog