

HOT TOPICS LIST
- MACD
- Fibonacci
- RSI
- Gann
- ADXR
- Stochastics
- Volume
- Triangles
- Futures
- Cycles
- Volatility
- ZIGZAG
- MESA
- Retracement
- Aroon
INDICATORS LIST
LIST OF TOPICS
PRINT THIS ARTICLE
by Donald W. Pendergast, Jr.
Shares of Chico's Fas Inc. have been struggling to regain lost ground in the wake of its summertime sell-off, but its near-term pathway looks to be back down to test a key support level.
Position: N/A
Donald W. Pendergast, Jr.
Freelance financial markets writer and online publisher of the Trendzetterz.com S&P 500 Weekly Forecast service.
PRINT THIS ARTICLE
CHS: Setting Up For A Short?
10/30/13 04:27:20 PMby Donald W. Pendergast, Jr.
Shares of Chico's Fas Inc. have been struggling to regain lost ground in the wake of its summertime sell-off, but its near-term pathway looks to be back down to test a key support level.
Position: N/A
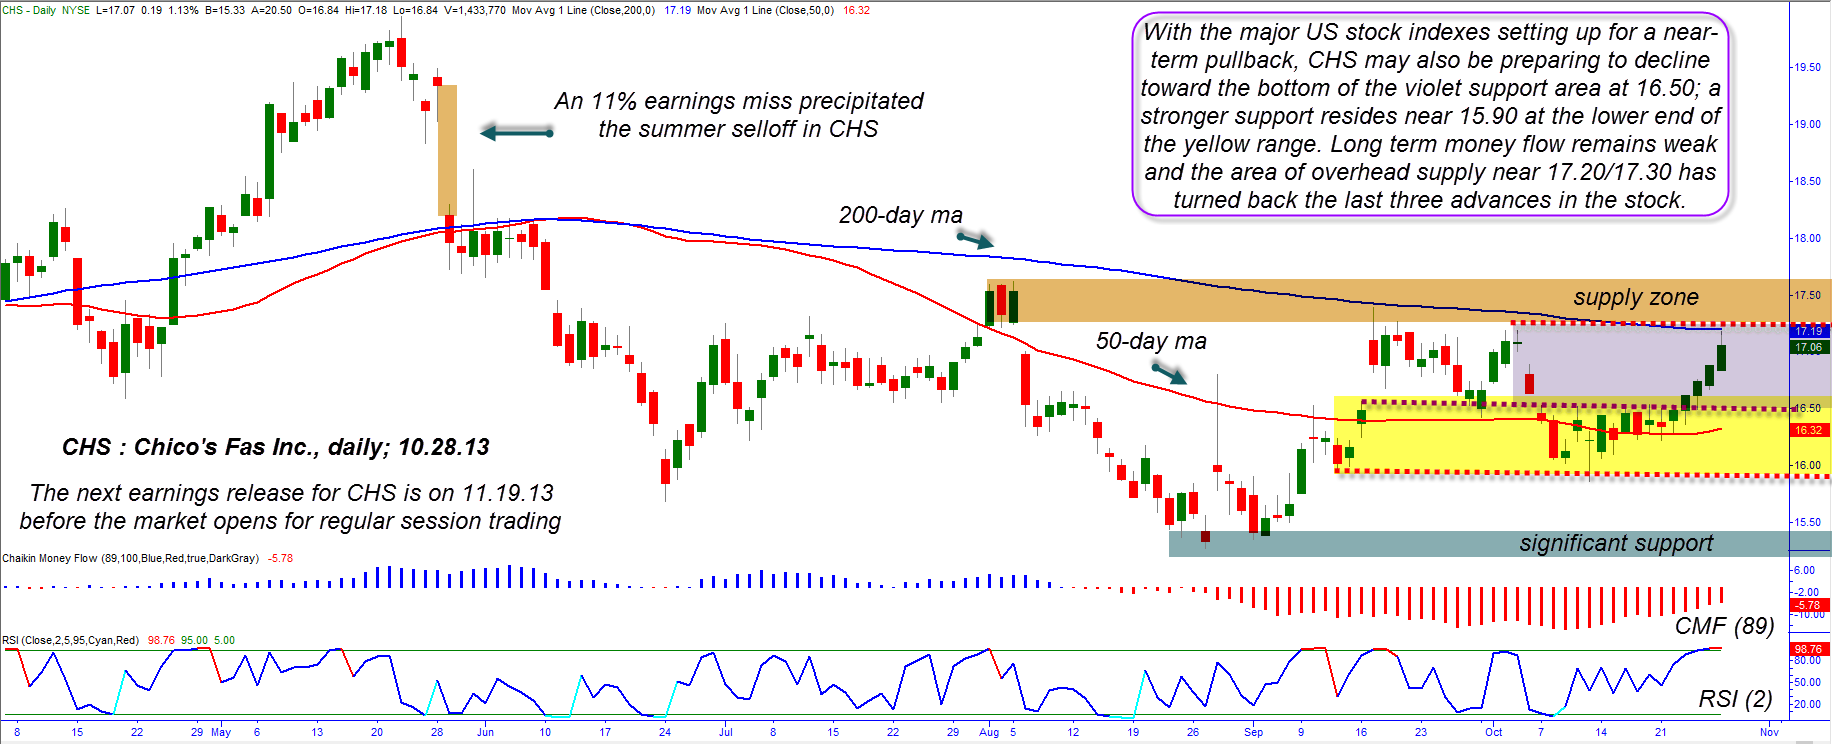
| Chico's Fas Inc. (CHS) shares endured a substantial revaluation over the summer of 2013; the stock missed its Q1 and Q2 earnings estimates in late May and again in late August 2013 and traders were quick to cast their votes, dropping the shares by 25%; it was the former earnings release that did most of the damage — a negative 11.11% earnings miss that unleashed a major wave of selling heading into the month of June. Interestingly, even though the earnings miss in late August was even larger (minus 15.63%) traders failed to unleash any more significant selling pressure against the stock. Since bottoming out, the stock has managed to evidence some strength, but is now caught between a very unique set of support/resistance barriers that suggest that its current rally is over and that its line of least resistance is back toward a key support level. Here's a closer look. |
|
| Figure 1. Shares of Chico's Fas Inc. (CHS) are trapped in a consolidation area framed by its 50- and 200-day moving averages and an area of heavy overhead supply. Odds favor some sort of a pullback to test support again before the 200-day average can be exceeded again. |
| Graphic provided by: TradeStation. |
| |
| Company earnings are a major factor that determines the general direction of its stock price, and it's easy to see just how dramatically a late spring 2013 earnings miss of minus 11.11% impacted CHS over the summer months; the stock dropped by 25% in three months, wiping out the gains previously achieved between August 2012 and May 2013 (Figure 1). After bottoming out in a major nulticycle low at 15.78, CHS rebounded nicely, but has since been turned back three times by both its blue 200-day moving average and a heavy overhead supply area (gold shaded zone). That's where the stock is now; seemingly unable to break well into the supply zone and/or above its declining 200-day MA. And unless its long term money flow histogram (based on the 89-day Chaikin Money flow) can get back above its zeroline again, the odds of a sustained rally from here look rather slim. The two-day RSI is also near its upper extreme of 100 and the daily candle with the long upper wick is suggesting that the stock's recent rise is about out of gas. With the major US stock indexes ready to sell off again — either before this week's FOMC announcement or after — wise traders currently long CHS would be wise to consider booking some profits now. |
|
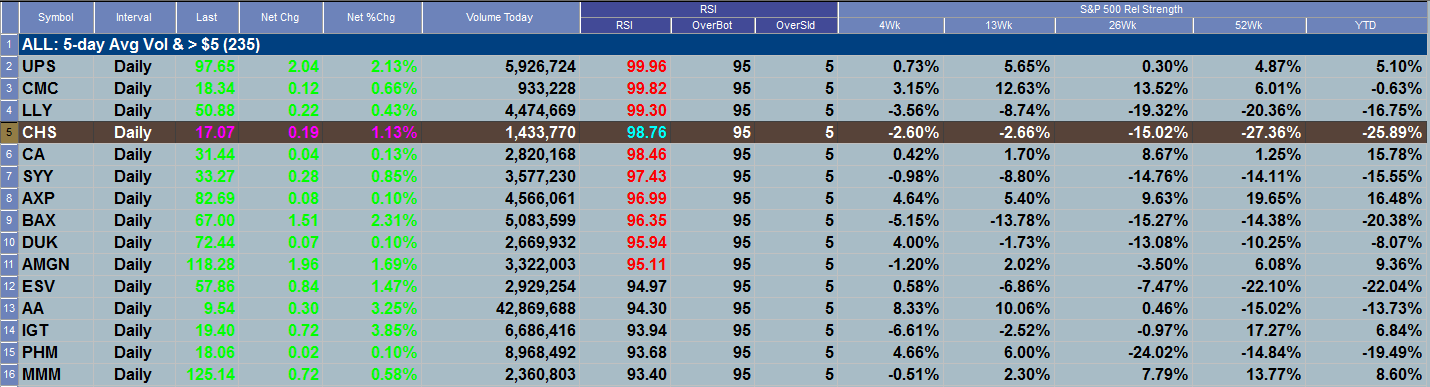
| Figure 2. CHS has been greatly underperforming the S&P 500 index (.SPX) over the past 26- and 52- week periods and is also down by more than 25% year to date. |
| Graphic provided by: TradeStation. |
| Graphic provided by: TradeStation RadarScreen. |
| |
| CHS releases its Q3 earnings results on November 19, 2013 before the market opens, so there could be some interesting price action in the stock in the next three weeks or so, particularly if the support zone near 16.50 holds on a pullback; if you see the stock quickly catch a bid on heavy volume after the decline, chances are the smart money is tipping their hand early, intent on accumulating the stock in advance of a positive earnings release. Conversely, if you see the 16.50 area fail and 15.90 gets tested again before a rally, be suspect about the stock's ability to break the 200-day MA, much less the overhead supply zone anytime soon. If you do decide to take a long entry on a successful test of 16.50, be sure to keep your account risks small (about 1%) and to take at least partial profits as the stock hits the 200-day average and/or supply zone. Running a three bar trail of the daily lows might help give the stock some room to back and fill should a larger swing move decide to develop. A proportional selloff in the major US stock indexes is a high probability event within the next week or so; be sure you are properly positioned to give back a minimum of open profits or to short the weakest stocks (based on fundamentals and technicals) in the S&P 500 (.SPX) and Nasdaq 100 (.NDX) indexes as this selloff develops. Trade wisely until we meet here again. |
Freelance financial markets writer and online publisher of the Trendzetterz.com S&P 500 Weekly Forecast service.
| Title: | Market consultant and writer |
| Company: | Trendzetterz |
| Address: | 81 Hickory Hollow Drive |
| Crossville, TN 38555 | |
| Phone # for sales: | 904-303-4814 |
| Website: | trendzetterz.com |
| E-mail address: | support@trendzetterz.com |
Traders' Resource Links | |
| Trendzetterz has not added any product or service information to TRADERS' RESOURCE. | |
Click here for more information about our publications!
Comments

Request Information From Our Sponsors
- StockCharts.com, Inc.
- Candle Patterns
- Candlestick Charting Explained
- Intermarket Technical Analysis
- John Murphy on Chart Analysis
- John Murphy's Chart Pattern Recognition
- John Murphy's Market Message
- MurphyExplainsMarketAnalysis-Intermarket Analysis
- MurphyExplainsMarketAnalysis-Visual Analysis
- StockCharts.com
- Technical Analysis of the Financial Markets
- The Visual Investor
- VectorVest, Inc.
- Executive Premier Workshop
- One-Day Options Course
- OptionsPro
- Retirement Income Workshop
- Sure-Fire Trading Systems (VectorVest, Inc.)
- Trading as a Business Workshop
- VectorVest 7 EOD
- VectorVest 7 RealTime/IntraDay
- VectorVest AutoTester
- VectorVest Educational Services
- VectorVest OnLine
- VectorVest Options Analyzer
- VectorVest ProGraphics v6.0
- VectorVest ProTrader 7
- VectorVest RealTime Derby Tool
- VectorVest Simulator
- VectorVest Variator
- VectorVest Watchdog