HOT TOPICS LIST
- MACD
- Fibonacci
- RSI
- Gann
- ADXR
- Stochastics
- Volume
- Triangles
- Futures
- Cycles
- Volatility
- ZIGZAG
- MESA
- Retracement
- Aroon
INDICATORS LIST
LIST OF TOPICS
PRINT THIS ARTICLE
by Koos van der Merwe
Gold is a protection and a hedge. Countries whose currency is depreciating are slowly buying gold, but with the London gold price falling from a high of $1887 is gold still protective?
Position: Accumulate
Koos van der Merwe
Has been a technical analyst since 1969, and has worked as a futures and options trader with First Financial Futures in Johannesburg, South Africa.
PRINT THIS ARTICLE
CHART ANALYSIS
Is It Time To Buy Gold?
10/29/13 03:50:36 PMby Koos van der Merwe
Gold is a protection and a hedge. Countries whose currency is depreciating are slowly buying gold, but with the London gold price falling from a high of $1887 is gold still protective?
Position: Accumulate
| The London gold fixing is a procedure by which the price of gold is determined twice each business day on the London market by the five members of The London Gold Market Fixing Ltd, on the premises of N M Rothschild & Sons. It is designed to fix a price for settling contracts between members of the London bullion market. This gold fixing provides a recognized rate that is used as a benchmark for pricing most gold products and derivatives in the world markets. The gold fix is conducted daily in US$, Pound sterling (GBP), and the Euro (EUR) at 10:30 am and 3:00 pm, London time. |

|
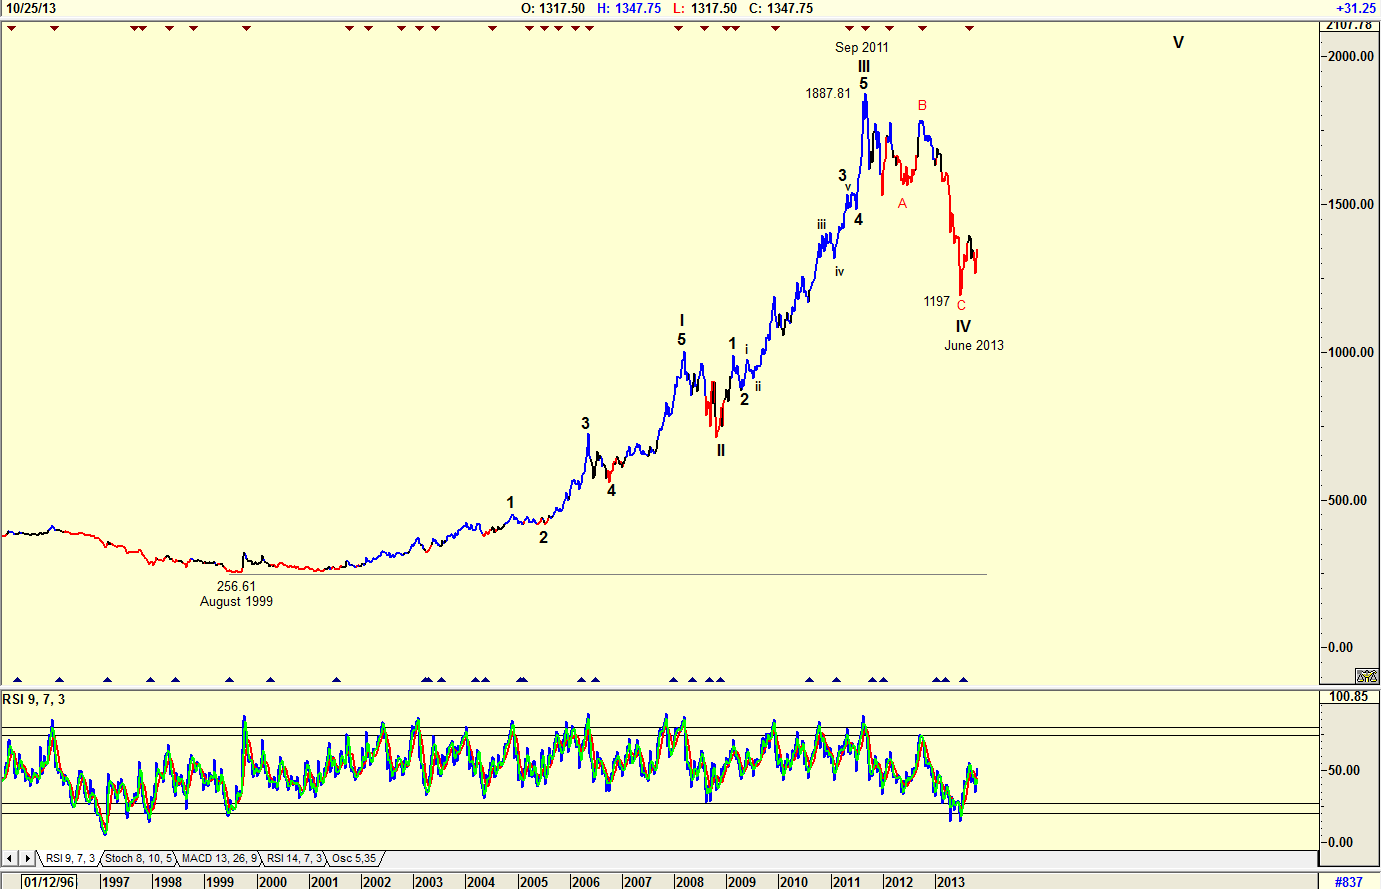
| Figure 1. Weekly Chart of London Gold. |
| Graphic provided by: AdvancedGET. |
| |
| The chart in Figure 1 shows how gold price rose from a low of $256.61 in August 1999 to a high of $1887.81 by September 2011. Of course, the first thought is that investors ran to the safety of gold as the market collapsed with the bursting of the technology bubble and when you look at the chart in Figure 2 this looks likely. Do note the 9-period RSI is suggesting that gold is a buy. |

|
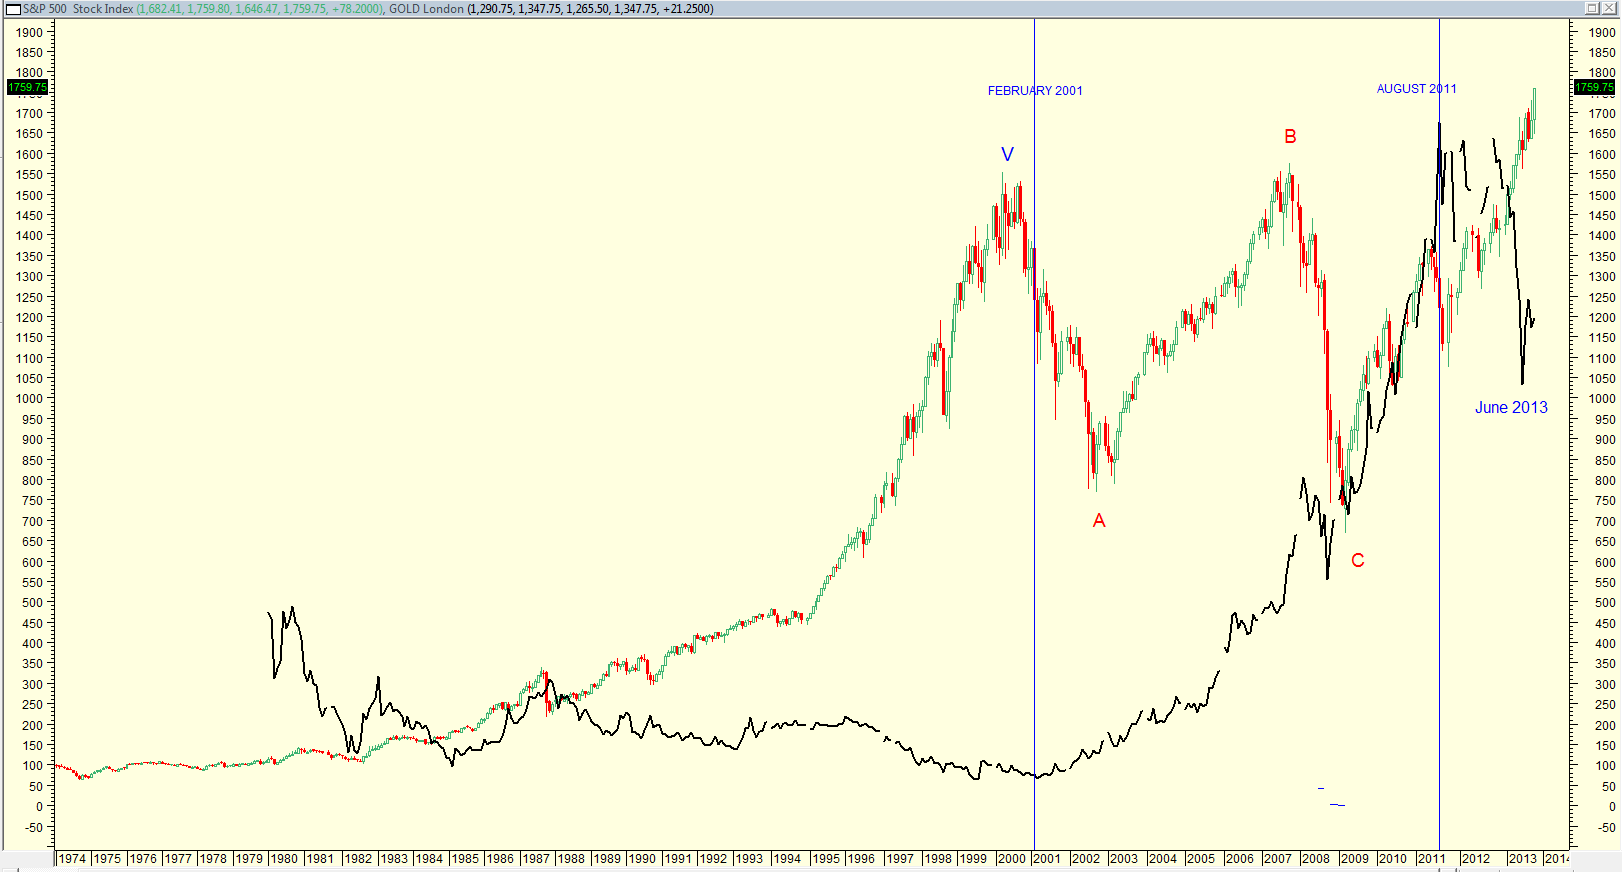
| Figure 2. London Gold (black line) superimposed on the S&P500 Index. |
| Graphic provided by: MetaStock. |
| |
| Figure 2 is a monthly chart of the S&P 500 index with the London gold price. Note how in February 2001 as the market realized that a major correction was occurring, the Gold price started rising and continued to rise, as the S&P 500 Index traced a major ABC Elliott Wave Correction. Note how the gold price started falling from August 2011 after the S&P500 index made a small correction, and started rising. It is as though the market realized that the bear market was no longer in force, and that investors should move from the protection of gold to the purchase of stocks. Since June 2013, even though the S&P500 index is still rising, London gold has started strengthening. Is this telling us that a correction is due? |

|
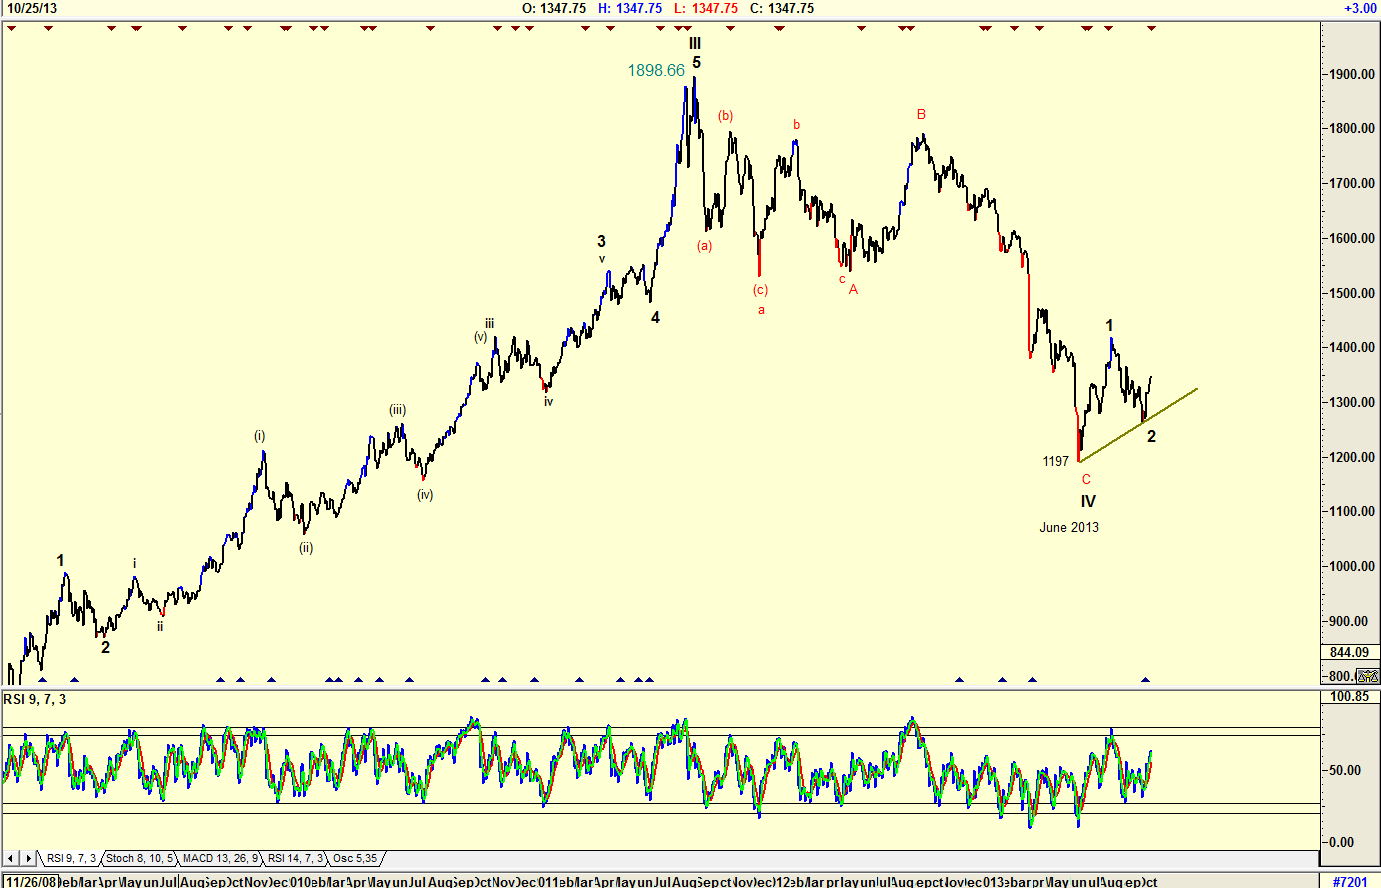
| Figure 3. Daily chart of London Gold price. |
| Graphic provided by: AdvancedGET. |
| |
| Looking at the daily chart in Figure 3, the Elliott Wave count suggests that London gold should start rising in a WAVE V which will take it well above $1898.66. So, what would cause the price of gold to rise? A major correction in the US market? I don't think so unless the present fight between Congress and the White House destroys the US economy. Are Asia, and especially China and India, looking to protect their economy as the United States' economy strengthens and their economy weakens? Very possible. Europe, with Angela Merkel of Germany pulling the strings, and the new Governor of the Bank of England, who kept Canada's banking system out of the mess that occurred in the US, does not look as though it will weaken, but will strengthen with the US economy. Yes, I would be a buyer of gold to a limited extent, but not mining companies who have heavy expenses. I would stick with Gold ETFs as a hedge. |
Has been a technical analyst since 1969, and has worked as a futures and options trader with First Financial Futures in Johannesburg, South Africa.
| Address: | 3256 West 24th Ave |
| Vancouver, BC | |
| Phone # for sales: | 6042634214 |
| E-mail address: | petroosp@gmail.com |
Click here for more information about our publications!
Comments

Request Information From Our Sponsors
- StockCharts.com, Inc.
- Candle Patterns
- Candlestick Charting Explained
- Intermarket Technical Analysis
- John Murphy on Chart Analysis
- John Murphy's Chart Pattern Recognition
- John Murphy's Market Message
- MurphyExplainsMarketAnalysis-Intermarket Analysis
- MurphyExplainsMarketAnalysis-Visual Analysis
- StockCharts.com
- Technical Analysis of the Financial Markets
- The Visual Investor
- VectorVest, Inc.
- Executive Premier Workshop
- One-Day Options Course
- OptionsPro
- Retirement Income Workshop
- Sure-Fire Trading Systems (VectorVest, Inc.)
- Trading as a Business Workshop
- VectorVest 7 EOD
- VectorVest 7 RealTime/IntraDay
- VectorVest AutoTester
- VectorVest Educational Services
- VectorVest OnLine
- VectorVest Options Analyzer
- VectorVest ProGraphics v6.0
- VectorVest ProTrader 7
- VectorVest RealTime Derby Tool
- VectorVest Simulator
- VectorVest Variator
- VectorVest Watchdog
