HOT TOPICS LIST
- MACD
- Fibonacci
- RSI
- Gann
- ADXR
- Stochastics
- Volume
- Triangles
- Futures
- Cycles
- Volatility
- ZIGZAG
- MESA
- Retracement
- Aroon
INDICATORS LIST
LIST OF TOPICS
PRINT THIS ARTICLE
by Donald W. Pendergast, Jr.
Now trading at multidecade highs, shares of FedEx Corporation may be approaching a near-term profit-taking zone.
Position: N/A
Donald W. Pendergast, Jr.
Freelance financial markets writer and online publisher of the Trendzetterz.com S&P 500 Weekly Forecast service.
PRINT THIS ARTICLE
NEW HIGHS-NEW LOWS
FedEx: All-Time Highs
10/28/13 04:56:19 PMby Donald W. Pendergast, Jr.
Now trading at multidecade highs, shares of FedEx Corporation may be approaching a near-term profit-taking zone.
Position: N/A
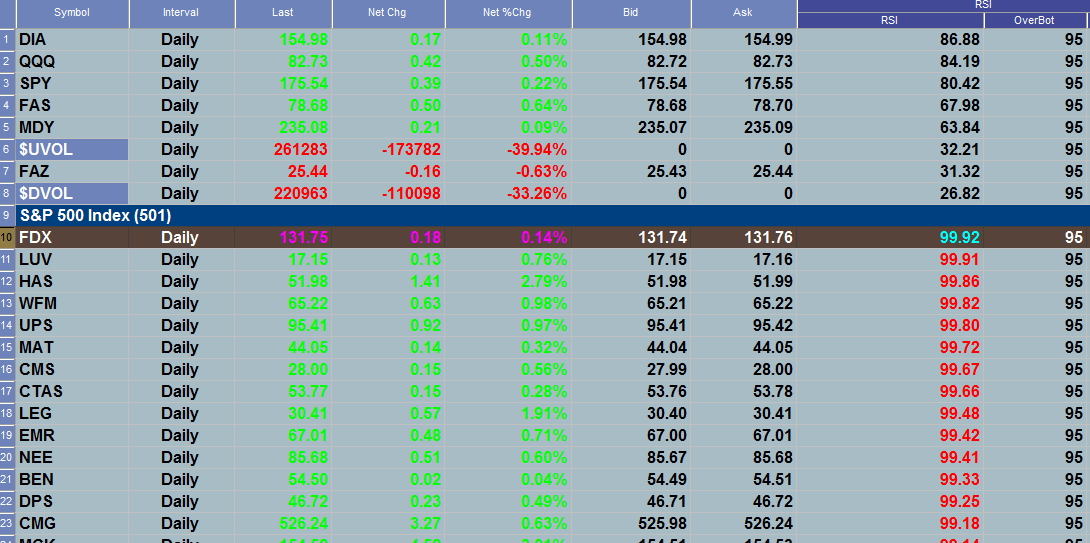
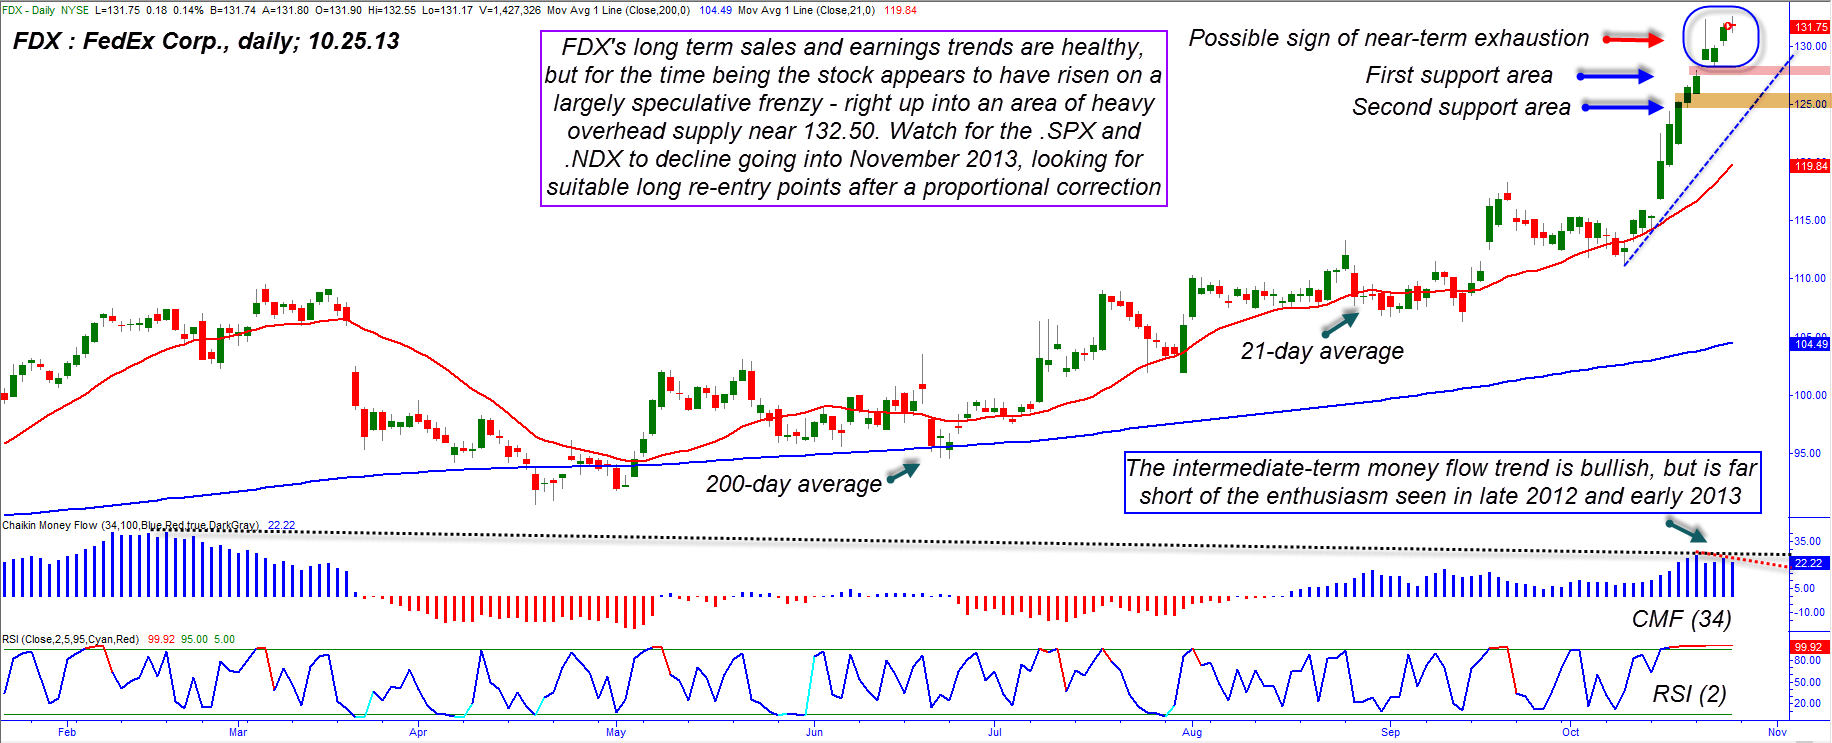
| Shares of FedEx Corp. (FDX) have enjoyed a near-parabolic rally over the past two weeks and are once again making new capacity for even more gains in price — as long as its earnings continue to impress Wall Street — but in the near-term the stock appears to need a rest before attempting to move even higher. Here's a closer look at FDX's daily chart (Figure 2). |

|
| Figure 1. FDX has the highest two-day RSI reading of all S&P 500 component stocks during the final hour of trading on Friday October 25, 2013. |
| Graphic provided by: TradeStation. |
| Graphic provided by: TradeStation RadarScreen. |
| |
| FDX's most recent sustained rally has its origins in the major nulticycle low made in April 2013; after bottoming out at 90.61 the stock moved higher in a sort of "two steps forward and one step backward" fashion into mid-September 2013. But after pulling back to 111.25 on October 9, 2013, the stock has gone on a near-parabolic tear, rising by more than 19.1% in just 15 calendar days. For a large-cap, long-established company, that's a remarkable performance, any way you care to look at it. However, the probabilities of such a rally continuing much further without a proportional correction (a minimum of 24% to 38% of the latest rally since October 9, 2013) grow smaller with each new session in which an extension of the rally occurs. If you look at the medium-term Chaikin Money flow histogram (CMF)(34) it's easy to see that although it is still well into its bullish zone (above its zeroline), the current histogram peak is far below that of the one seen as FDX made a nulticycle high in February 2013. In addition, there is also a minor price/money flow divergence evident within the current CMF (34) histogram peak and this is telling traders two important things: 1. There is long-term distribution underway. 2. There is near-term distribution underway. In both instances, distribution is evident when prices make new highs but the money flow histogram does not, and in fact drops lower. Professional (smart money) buying accounts for 80% of the daily volume in most stocks, and when prices keep rising on lower volumes, you can be pretty sure that it's the less-sophisticated retail traders that are bidding prices ever higher, with the pros only too happy to sell them all of the shares they desire. Although no one knows exactly when this rally will finally end, the last few daily candlesticks also tell a tale of excessive bullish enthusiasm meeting up with an area of heavy overhead supply. Notice the long upper candle wicks on Tuesday's and Friday's candles (on the 22nd and 25th, respectively); both of the wicks reached up toward the 132.30/132.55 zone only to be turned back quickly. There are two other technicals that suggest caution for the bulls is prudent: 1. FDX is far extended above its red 21-day simple moving average. 2. The two-day RSI has been pegged near its upper level for the longest duration since February 2013. |

|
| Figure 2. FedEx Corp. (FDX) has risen by more than 19% in the last 15 calendar days; the stock appears to be finding strong resistance near an overhead supply zone near 132.50, however. |
| Graphic provided by: TradeStation. |
| |
| At the very least, this technical mix should be enough to cause current longs in the stock to run a fairly close trailing stop and/or put option protection. For the bears, it's too early to call a reversal lower, but both bulls and bears alike still might want to see how FDX deals with the two support levels highlighted on its daily chart (near 127.50 and 125.00, respectively). Either area could be good for another bounce higher in FDX, but if the lower level at 125.00 fails to hold on a retest then the bias will shift toward lower valuations later in the fourth quarter of 2013. Monitor both areas of support in FDX along with the general health of the broad markets and you'll have a better idea of what the future has in store for FDX's share prices. Trade wisely until we meet here again. |
Freelance financial markets writer and online publisher of the Trendzetterz.com S&P 500 Weekly Forecast service.
| Title: | Market consultant and writer |
| Company: | Trendzetterz |
| Address: | 81 Hickory Hollow Drive |
| Crossville, TN 38555 | |
| Phone # for sales: | 904-303-4814 |
| Website: | trendzetterz.com |
| E-mail address: | support@trendzetterz.com |
Traders' Resource Links | |
| Trendzetterz has not added any product or service information to TRADERS' RESOURCE. | |
Click here for more information about our publications!
PRINT THIS ARTICLE

Request Information From Our Sponsors
- StockCharts.com, Inc.
- Candle Patterns
- Candlestick Charting Explained
- Intermarket Technical Analysis
- John Murphy on Chart Analysis
- John Murphy's Chart Pattern Recognition
- John Murphy's Market Message
- MurphyExplainsMarketAnalysis-Intermarket Analysis
- MurphyExplainsMarketAnalysis-Visual Analysis
- StockCharts.com
- Technical Analysis of the Financial Markets
- The Visual Investor
- VectorVest, Inc.
- Executive Premier Workshop
- One-Day Options Course
- OptionsPro
- Retirement Income Workshop
- Sure-Fire Trading Systems (VectorVest, Inc.)
- Trading as a Business Workshop
- VectorVest 7 EOD
- VectorVest 7 RealTime/IntraDay
- VectorVest AutoTester
- VectorVest Educational Services
- VectorVest OnLine
- VectorVest Options Analyzer
- VectorVest ProGraphics v6.0
- VectorVest ProTrader 7
- VectorVest RealTime Derby Tool
- VectorVest Simulator
- VectorVest Variator
- VectorVest Watchdog
