HOT TOPICS LIST
- MACD
- Fibonacci
- RSI
- Gann
- ADXR
- Stochastics
- Volume
- Triangles
- Futures
- Cycles
- Volatility
- ZIGZAG
- MESA
- Retracement
- Aroon
INDICATORS LIST
LIST OF TOPICS
PRINT THIS ARTICLE
by Billy Williams
A year ago, this stock fell apart and was dismissed by Wall Street but, now, the Street is taking notice again and so should you.
Position: Buy
Billy Williams
Billy Williams has been trading the markets for 27 years, specializing in momentum trading with stocks and options.
PRINT THIS ARTICLE
STOCKS
CLB On The Move
10/25/13 04:29:17 PMby Billy Williams
A year ago, this stock fell apart and was dismissed by Wall Street but, now, the Street is taking notice again and so should you.
Position: Buy
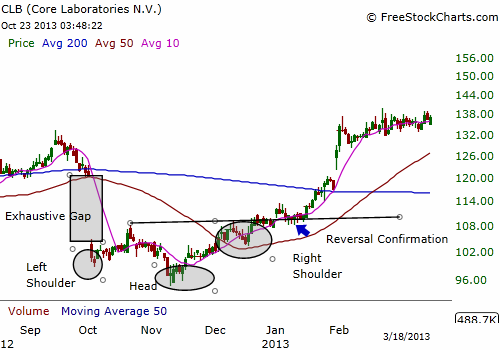
| Core Laboratories (CLB) has been one of the best performing "shovel and pick" stocks in recent years in the oil and gas industry. It provides reservoir description, production enhancement, and reservoir management services to the oil and gas industry worldwide. A little over a year ago, CLB appeared to have fallen over a cliff into a deep downslide. Today, CLB has recovered from that low point and looks to be setting up to go even higher. First, you need to understand the significance of CLB's price low last year in October 2012 and how it set the stage for the huge rally the stock underwent. On October 2, 2012, CLB had an explosive bearish gap that sank the stock's share value by almost 17% in a single day. The stock cratered on bearish volume of more than 900% of its 50-day average volume, and sliced through two key technical factors watched by almost every major trading institution — the 50-day SMA and the 200-day SMA. Once these two SMAs were broken, the bears had crossed the Rubicon and taken control of the stock. |

|
| Figure 1. Last year, CLB experienced a huge bearish gap on almost 900% of its five-day average volume. However, over time the stock began to recover, form an inverse head & shoulders pattern and climb its way back over its 50-day and 200-day SMA. |
| Graphic provided by: www.freestockcharts.com. |
| |
| CLB did a dead cat bounce in the following days since the bearish gap, giving the appearance of bullish support but then quickly rolled over and started to trade down again. Price set an annual low at $94.72 and to the untrained eye, it looked grim for CLB. Investors fled the stock in droves. But, the dip in price to that low set the stage for the rally that was yet to come. When a stock gaps down as much and on such high volume as CLB did, it can indicate that all the sellers have left a burning building but, when the dust settles, there are no more sellers to push the stock lower, at least to a significant degree. Those timid bulls that were hanging on after the crash held on to their positions in the hopes that the stock would recover, but when the stock began to decline again, they gave up and sold out. This forced the stock to drop even lower. |

|
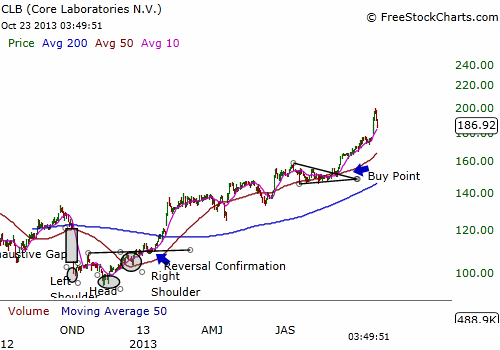
| Figure 2. CLB continued to trade above its major MA's for some time but failed to form a recognizable first stage base pattern until this past summer where it formed a bullish triangle. |
| Graphic provided by: www.freestockcharts.com. |
| |
| It was this last group of bullish investors that pushed CLB lower but after they sold, the bulls stepped in aggressively and supported the stock's price level. At this level, two key criteria were setting up for an Inverse Head & Shoulders pattern to form; a left-shoulder and the head. The Inverse Head & Shoulders pattern is a reversal pattern that signals a reverse in the current trend and, as the bulls stepped in to help the stock rally, a pullback later took place that formed the last part of the pattern — the right shoulder. Once the trendline from the head portion of the pattern's neckline to the right shoulder portion was broken, the reversal was confirmed and a bullish signal was triggered. |

|
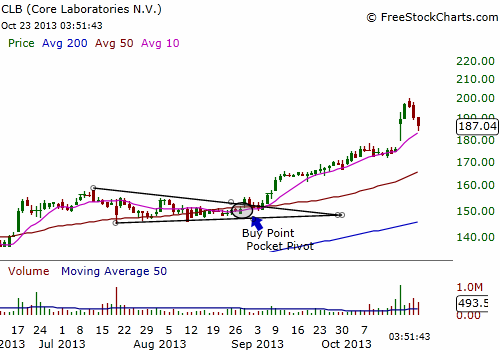
| Figure 3. On August 27, 2013, a early long entry was formed when a pocket pivot closed above it's 10-day SMA on higher volume, and the next day another buy entry was signaled when price broke above its upper trendline of the Bullish Triangle. The stock rallied and racked up a quick 27% gain. Now, the stock is pulling back slightly but may resume its bullish run and offer another low-risk entry. |
| Graphic provided by: www.freestockcharts.com. |
| |
| The 200-day SMA still sits overhead the stock's price action so, for the conservative trader, it might be wise for the stock's price action to clear the SMA and begin trading over it before taking any new long positions. And, at the end of January 2013, CLB did clear the 200-day SMA and begin trading squarely in bullish territory, above the 200-day SMA. CLB traded a healthy distance above both major SMAs but didn't form a recognizable base pattern until the summer where its trade volume dried up and a bullish triangle formed. A low-risk entry was triggered on August 28, 2013 when price traded through the pattern's upper trendline on high volume and rallied over 45 points, almost 27%, in less than two months. A pocket pivot on August 27, 2013, the day before the breakout, would have put you in the stock a day early for an even earlier entry. |
| If the stock stays at, or near, its current level, then the eight-week rule takes effect which states that a stock that rallies 20% to 25% within eight weeks of its breakout entry should be held on to. The reason is that it has the potential to rally even higher and become a "home run" trade close to a 50% to 100% return over the next year. That said, you should raise your stop loss to breakeven and use a trailing stop. But, what if you didn't catch the move when it broke out? Wait for the stock to pull back, or form a second base pattern, and you'll have the opportunity to enter the stock or add to your position. Also, keep in mind that high-performing stocks always follow a significant low made in its price action so this move in CLB is still early and has plenty of upside room. |
Billy Williams has been trading the markets for 27 years, specializing in momentum trading with stocks and options.
| Company: | StockOptionSystem.com |
| E-mail address: | stockoptionsystem.com@gmail.com |
Traders' Resource Links | |
| StockOptionSystem.com has not added any product or service information to TRADERS' RESOURCE. | |
Click here for more information about our publications!
Comments
Date: 10/26/13Rank: 2Comment:

Request Information From Our Sponsors
- StockCharts.com, Inc.
- Candle Patterns
- Candlestick Charting Explained
- Intermarket Technical Analysis
- John Murphy on Chart Analysis
- John Murphy's Chart Pattern Recognition
- John Murphy's Market Message
- MurphyExplainsMarketAnalysis-Intermarket Analysis
- MurphyExplainsMarketAnalysis-Visual Analysis
- StockCharts.com
- Technical Analysis of the Financial Markets
- The Visual Investor
- VectorVest, Inc.
- Executive Premier Workshop
- One-Day Options Course
- OptionsPro
- Retirement Income Workshop
- Sure-Fire Trading Systems (VectorVest, Inc.)
- Trading as a Business Workshop
- VectorVest 7 EOD
- VectorVest 7 RealTime/IntraDay
- VectorVest AutoTester
- VectorVest Educational Services
- VectorVest OnLine
- VectorVest Options Analyzer
- VectorVest ProGraphics v6.0
- VectorVest ProTrader 7
- VectorVest RealTime Derby Tool
- VectorVest Simulator
- VectorVest Variator
- VectorVest Watchdog
