HOT TOPICS LIST
- MACD
- Fibonacci
- RSI
- Gann
- ADXR
- Stochastics
- Volume
- Triangles
- Futures
- Cycles
- Volatility
- ZIGZAG
- MESA
- Retracement
- Aroon
INDICATORS LIST
LIST OF TOPICS
PRINT THIS ARTICLE
by Koos van der Merwe
The Affordable Care Act is becoming a part of America.
Position: Accumulate
Koos van der Merwe
Has been a technical analyst since 1969, and has worked as a futures and options trader with First Financial Futures in Johannesburg, South Africa.
PRINT THIS ARTICLE
ENVELOPES
United Therapeutics Corporation
10/24/13 03:40:06 PMby Koos van der Merwe
The Affordable Care Act is becoming a part of America.
Position: Accumulate
| As the Affordable Care Act becomes a part of the health system in the United States, more citizens will be able to receive medical treatments previously denied to them. Beneficiaries will be companies that manufacture drugs, many of them expensive until their patents run out when generics can be manufactured at greatly reduced prices. Companies that spend millions of dollars on research will benefit, as their products become available to more patients. One of these corporations is United Therapeutics, a biotechnology company focused on the development of unique products that address the unmet medical needs of patients with chronic and life threatening conditions. |

|
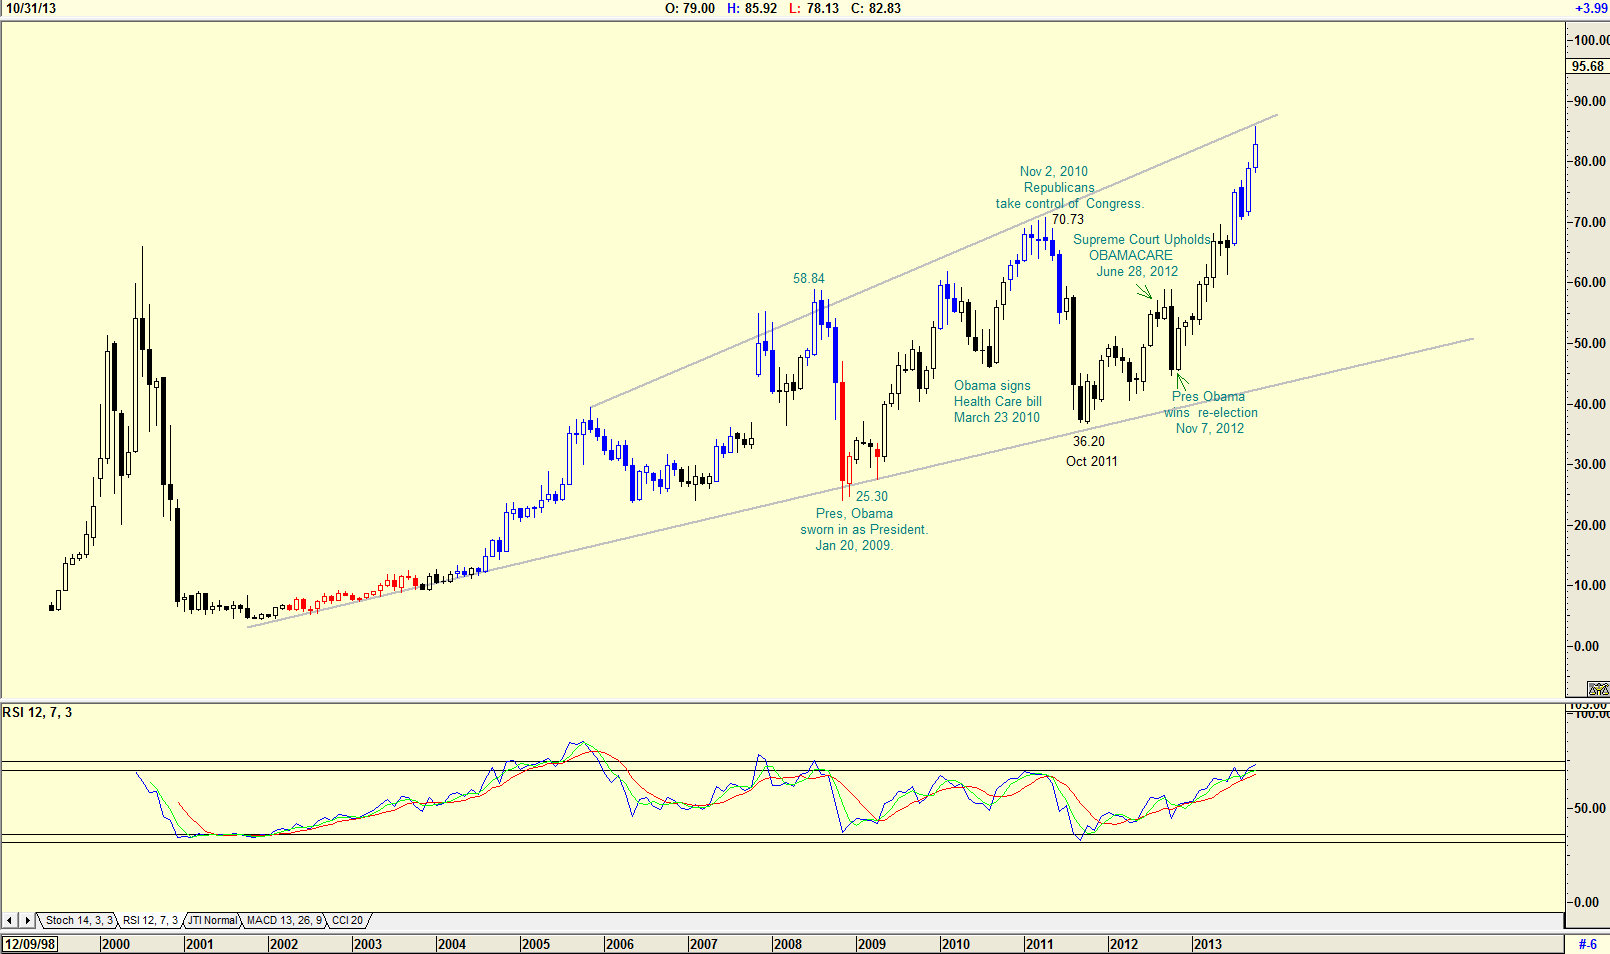
| Figure 1. Monthly chart with political implications and history. |
| Graphic provided by: AdvancedGET. |
| |
| In Figure 1 you see a monthly chart of United Therapeutics with the political implications and how they affected the share price. Note how the share price dropped from a high of $70.73 on November 2, 2010 when Republicans won control of Congress to a low of $36.20 by October 2011. The share price started recovering but fell after the Supreme Court upheld Obamacare on uncertainty as to the 2012 Presidential election. However, once it was announced that Obama had been re-elected, the share price rose strongly to its current price of $82.83. |

|
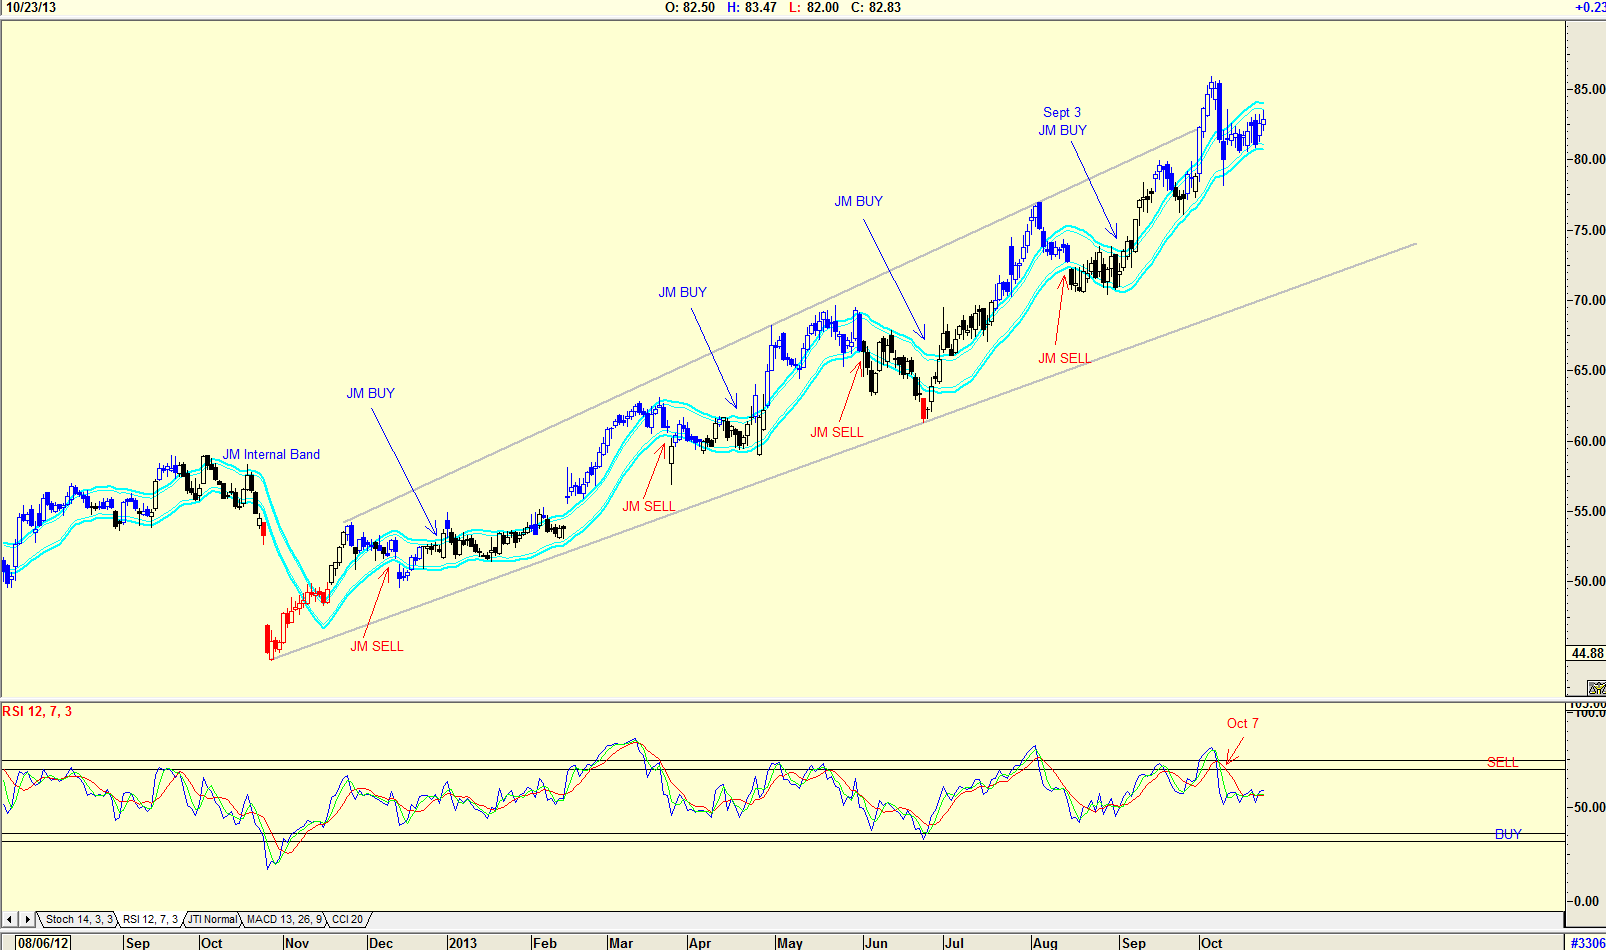
| Figure 2. Daily chart suggesting overbought conditions. |
| Graphic provided by: AdvancedGET. |
| |
| The chart in Figure 2 is a daily chart with a JM Internal Band indicator that gave a buy on September 3, 2012. The JM internal band indicator is a 15-period simple moving average offset by 2% positive and 2% negative. A move above the upper band suggests a buy signal and a move below the lower band suggests a sell signal as shown on the chart. A buy signal was given on September 3, 2013. The RSI however gave a sell on October 7, 2013 creating uncertainty. |

|
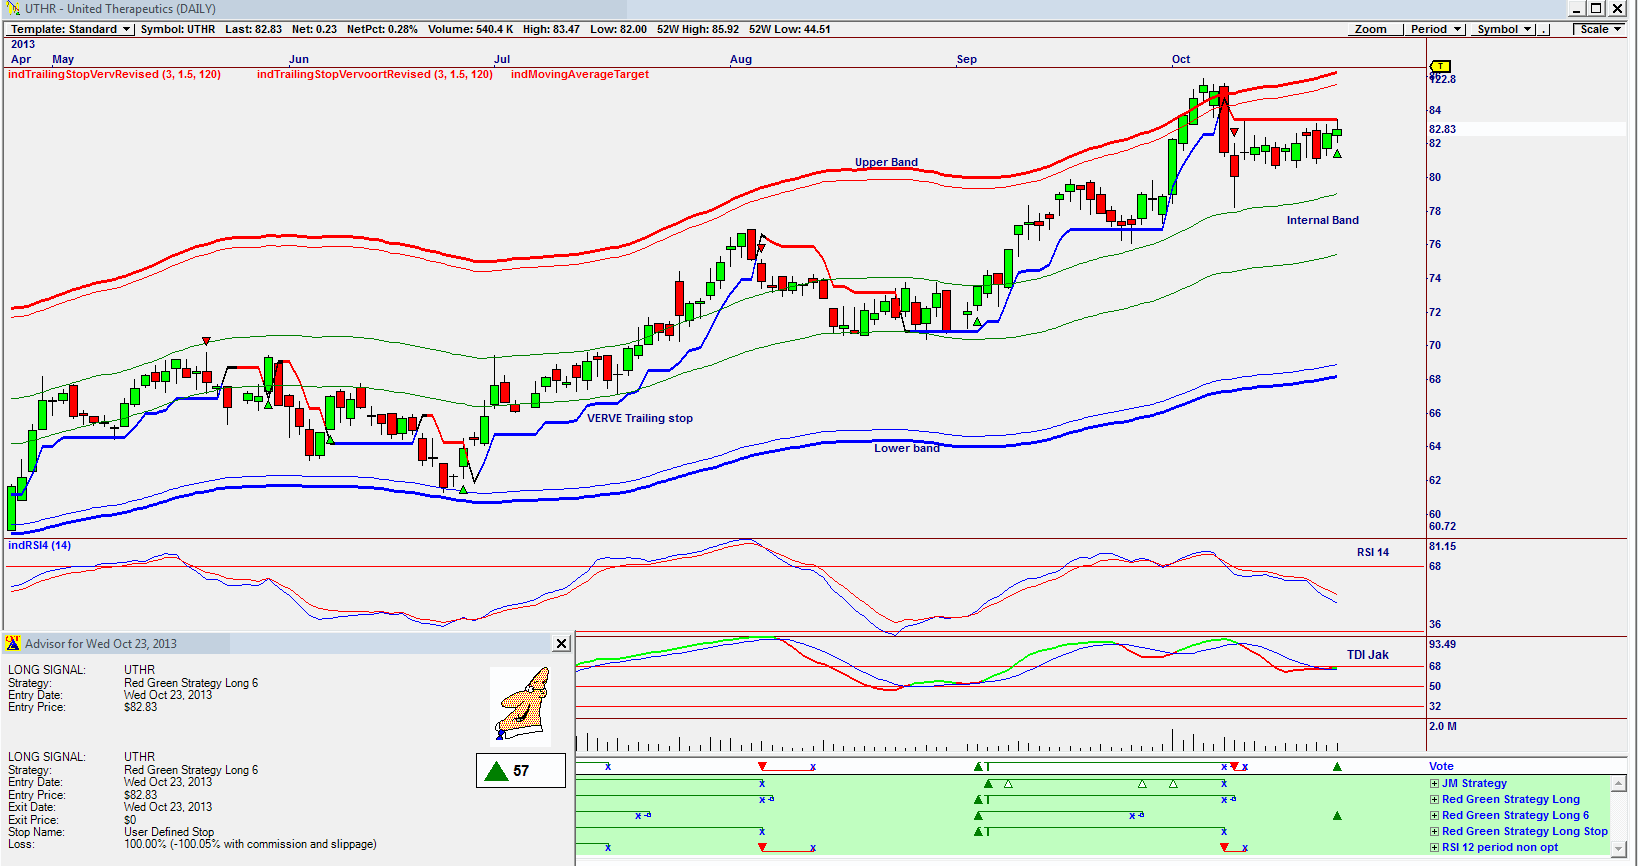
| Figure 3. Daily Omnitrader chart showing a VOTE line buy signal. |
| Graphic provided by: Omnitrader. |
| |
| The chart in Figure 3 is what brought United Therapeutics to my attention. The Omnitrader chart gave a buy signal on the vote line based on the Red Green Strategy Long 6. The Advisor rating is 57, which is average, nothing wonderful. The RSI indicator is falling suggesting weakness, but the TDI indicator is suggesting a possible buy. I would not be a buyer of UTHR at the moment. I would look for the price to fall to the upper line of the internal band. This is a share on my watch list. As the Affordable Care Act becomes established, prices should rise further. |
Has been a technical analyst since 1969, and has worked as a futures and options trader with First Financial Futures in Johannesburg, South Africa.
| Address: | 3256 West 24th Ave |
| Vancouver, BC | |
| Phone # for sales: | 6042634214 |
| E-mail address: | petroosp@gmail.com |
Click here for more information about our publications!
Comments
Date: 10/26/13Rank: 4Comment:

|

Request Information From Our Sponsors
- StockCharts.com, Inc.
- Candle Patterns
- Candlestick Charting Explained
- Intermarket Technical Analysis
- John Murphy on Chart Analysis
- John Murphy's Chart Pattern Recognition
- John Murphy's Market Message
- MurphyExplainsMarketAnalysis-Intermarket Analysis
- MurphyExplainsMarketAnalysis-Visual Analysis
- StockCharts.com
- Technical Analysis of the Financial Markets
- The Visual Investor
- VectorVest, Inc.
- Executive Premier Workshop
- One-Day Options Course
- OptionsPro
- Retirement Income Workshop
- Sure-Fire Trading Systems (VectorVest, Inc.)
- Trading as a Business Workshop
- VectorVest 7 EOD
- VectorVest 7 RealTime/IntraDay
- VectorVest AutoTester
- VectorVest Educational Services
- VectorVest OnLine
- VectorVest Options Analyzer
- VectorVest ProGraphics v6.0
- VectorVest ProTrader 7
- VectorVest RealTime Derby Tool
- VectorVest Simulator
- VectorVest Variator
- VectorVest Watchdog
