HOT TOPICS LIST
- MACD
- Fibonacci
- RSI
- Gann
- ADXR
- Stochastics
- Volume
- Triangles
- Futures
- Cycles
- Volatility
- ZIGZAG
- MESA
- Retracement
- Aroon
INDICATORS LIST
LIST OF TOPICS
PRINT THIS ARTICLE
by Donald W. Pendergast, Jr.
A number of S&P 500 index stocks are manifesting short-term reversal patterns, including shares of Devon Energy.
Position: N/A
Donald W. Pendergast, Jr.
Freelance financial markets writer and online publisher of the Trendzetterz.com S&P 500 Weekly Forecast service.
PRINT THIS ARTICLE
Devon Energy: Due For Pullback
10/24/13 03:35:23 PMby Donald W. Pendergast, Jr.
A number of S&P 500 index stocks are manifesting short-term reversal patterns, including shares of Devon Energy.
Position: N/A
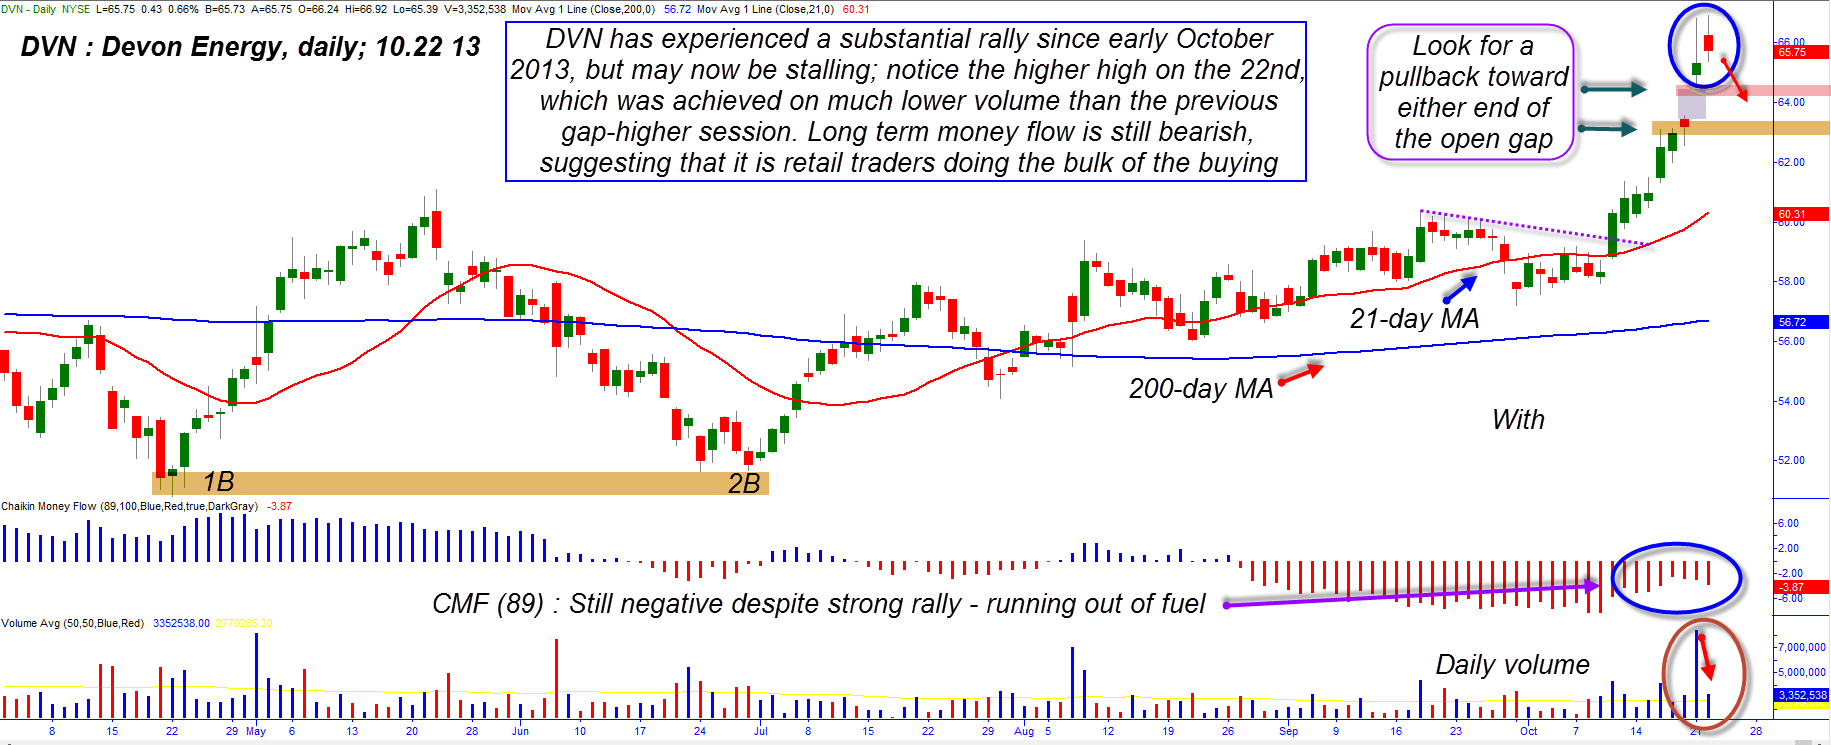
| So far, the major US stock indexes have done well during the month of October — with the S&P 500 index even managing to make a new all-time high along the way — but with so many stocks now extended to a range where the statistical probability of a bearish reversal is likely, it might pay to start scanning for stocks with high probability short setups. Here's a look at one such stock's daily chart, that of Devon Energy (DVN) in Figure 1. |

|
| Figure 1. Devon Energy's long-term money flow trend remains stubbornly bearish, despite the stock's latest rally; probabilities favor at least a short-term correction in this stock, most likely to either side of its latest open gap. |
| Graphic provided by: TradeStation. |
| |
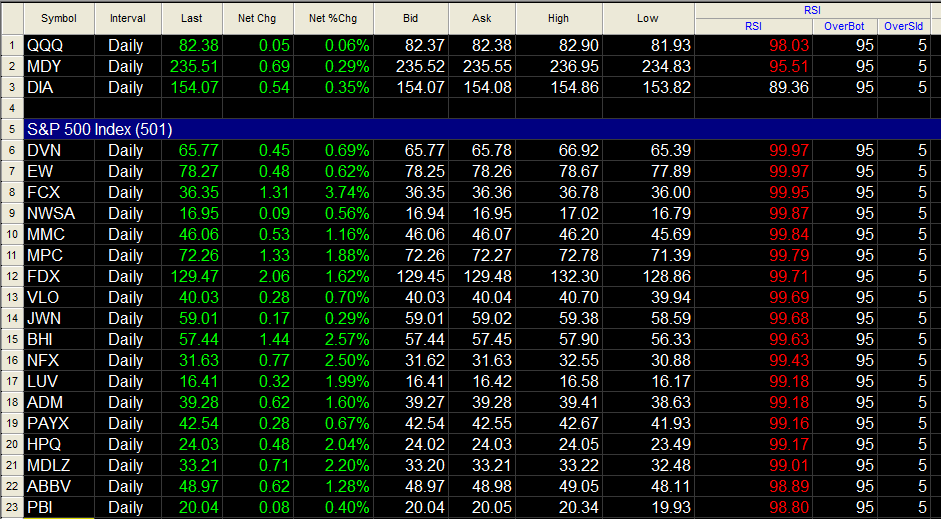
| As this is being written, 22.4% of all S&P 500 component stocks have two-day RSI readings greater than 95.00 and 77% have two-day RSI readings above 50.00. At the same time, a mere .26% have two-day RSI readings below 10.00. Clearly, this is an extremely bullish market bias. However, it is also getting to a point where the probabilities of a near-term reversal grow larger with each passing day. It's at market extremes like this that savvy traders will start looking at daily charts of stocks with the following technical characteristics: 1. A two-day RSI reading greater than 99.00 2. Negative long-term money flow, using the 89 or 100-day Chaikin Money flow histogram (CMF)(89) 3. A bearish key reversal pattern Using TradeStation's Radar Screen, it's easy to find all of the 99.00-plus RSI S&P 500 stocks, along with those having negative long-term money flow and bearish reversal bar patterns; one of the better looking charts happens to belong to that of Devon Energy, as all three of those aforementioned criteria are met nicely. DVN has enjoyed a strong rally for the last two weeks, but if you look at the money flow histogram, you can see that this rally is quickly running out of fuel as the CMF (89) is still mired in bearish territory despite the sharp rise in prices. This is telling us that it's retail traders who are bidding the stock ever higher, with the "smart money" only too willing to sell them all the shares they could want. Notice also the final push higher on October 22, 2013; DVN made a higher high early in the session, only to drop back below Monday's high, and that the higher high was made on such pathetic volume was a tip-off that there was plenty of supply available above the 66.92 area. And given that not only DVN, but nearly a quarter of S&P 500 stocks are technically overbought (on a short-term basis), this setup in DVN looks to be of relatively low risk for skilled short sellers, one that even comes with a ready-made profit target. |

|
| Figure 2. Along with Devon Energy (DVN), several other stocks in the S&P 500 are also manifesting reversal patterns on their daily charts, including AAPL, GE, SPLS, INTC and WFM. |
| Graphic provided by: TradeStation. |
| Graphic provided by: TradeStation RadarScreen. |
| |
| Playing DVN on the short side is straightforward: 1. If the stock drops below 65.35, short the shares and place your initial stop near 66.30 (Tuesday's open price). Keep your account risk at 1% maximum on this trade. 2. Use the upper end of the open gap (64.51)at your price target for half your trade (or even all of it if you are more timid). 3. Use the lower end of the open gap (63.58) as the absolute maximum profit target if you decide to let the other half of the position run. 4. Run a close trailing stop for the life of the trade; a one-bar trail of the highs might be advisable to keep the risks smaller should the trade play out as anticipated. The Dow 30 and S&P 500 appear to be close to a bearish turn, one that may retrace at least 38 to 50% of the gains seen since early October 2013; if you are currently long any large cap US stocks, be sure to have an exit and/or profit protection strategy in place and if you are a skilled short trader, prepare for a veritable buffet table of appetizing shorting opportunities within the next several trading sessions — by simply using the simple scanning template discussed earlier in the article. Trade wisely until we meet here again. |
Freelance financial markets writer and online publisher of the Trendzetterz.com S&P 500 Weekly Forecast service.
| Title: | Market consultant and writer |
| Company: | Trendzetterz |
| Address: | 81 Hickory Hollow Drive |
| Crossville, TN 38555 | |
| Phone # for sales: | 904-303-4814 |
| Website: | trendzetterz.com |
| E-mail address: | support@trendzetterz.com |
Traders' Resource Links | |
| Trendzetterz has not added any product or service information to TRADERS' RESOURCE. | |
Click here for more information about our publications!
Comments

Request Information From Our Sponsors
- StockCharts.com, Inc.
- Candle Patterns
- Candlestick Charting Explained
- Intermarket Technical Analysis
- John Murphy on Chart Analysis
- John Murphy's Chart Pattern Recognition
- John Murphy's Market Message
- MurphyExplainsMarketAnalysis-Intermarket Analysis
- MurphyExplainsMarketAnalysis-Visual Analysis
- StockCharts.com
- Technical Analysis of the Financial Markets
- The Visual Investor
- VectorVest, Inc.
- Executive Premier Workshop
- One-Day Options Course
- OptionsPro
- Retirement Income Workshop
- Sure-Fire Trading Systems (VectorVest, Inc.)
- Trading as a Business Workshop
- VectorVest 7 EOD
- VectorVest 7 RealTime/IntraDay
- VectorVest AutoTester
- VectorVest Educational Services
- VectorVest OnLine
- VectorVest Options Analyzer
- VectorVest ProGraphics v6.0
- VectorVest ProTrader 7
- VectorVest RealTime Derby Tool
- VectorVest Simulator
- VectorVest Variator
- VectorVest Watchdog
