HOT TOPICS LIST
- MACD
- Fibonacci
- RSI
- Gann
- ADXR
- Stochastics
- Volume
- Triangles
- Futures
- Cycles
- Volatility
- ZIGZAG
- MESA
- Retracement
- Aroon
INDICATORS LIST
LIST OF TOPICS
PRINT THIS ARTICLE
by Donald W. Pendergast, Jr.
When a stock gaps higher into a strong resistance zone, wise traders will exercise patience and wait for a suitable entry point to appear.
Position: N/A
Donald W. Pendergast, Jr.
Freelance financial markets writer and online publisher of the Trendzetterz.com S&P 500 Weekly Forecast service.
PRINT THIS ARTICLE
RESISTANCE LINE
SAP: Great Earnings, Heavy Resistance
10/22/13 04:45:30 PMby Donald W. Pendergast, Jr.
When a stock gaps higher into a strong resistance zone, wise traders will exercise patience and wait for a suitable entry point to appear.
Position: N/A
| Despite a strong Q3 earnings surprise, shares of SAP still need to overcome two strong daily chart resistance zones in order to gain more traction. Here's a look at its daily chart along with an idea on how to potentially profit if the shares pull back slightly before moving higher again. |

|
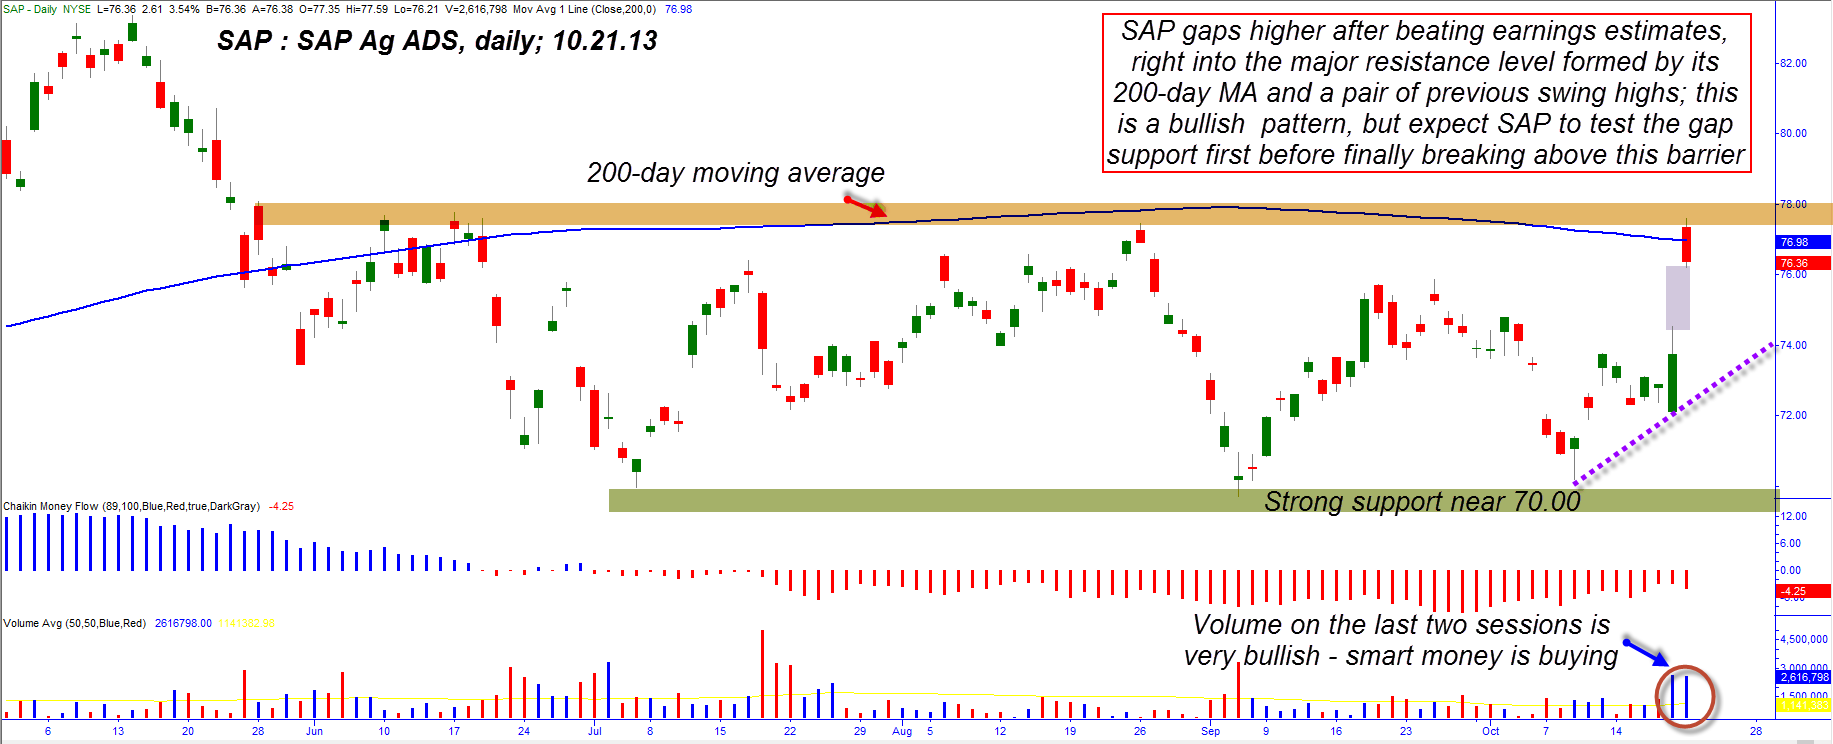
| Figure 1: After testing major support near 70.00 again, SAP rockets higher as its Q3 2013 earnings are released. The triple-top buy pattern is exceedingly bullish, given the stock's great earnings report. |
| Graphic provided by: TradeStation. |
| |
| SAP Ag ADR (SAP) the giant German enterprise software manufacturer, released their Q3 2013 earnings before the US markets opened on Monday October 21, 2103, gapping sharply higher at the open — up by more than 6.80% in the first minutes of the trading session. But then the stock stalled out and with only 30 minutes left in the trading day had pulled back by $2.50. So why didn't SAP just keep chugging higher, maybe enduring a mild intraday pullback before going on to exceed its pre-market high of 78.77? The stock did beat its earnings estimates by five cents after all ($1.03 per share instead of the $.98 consensus estimate), so what's the story here? As usual, this is another "support and resistance" event, and getting the "big picture" view pretty much explains why SAP stalled out so noticeably once it hit a certain price level. Here's the main reason for the lack of intraday follow-through after the open: 1. SAP blasted above its daily 200-day simple moving average (SMA) in the pre-market — so strong was the buying pressure — but as the stock opened for the regular session at 9:30 ET, SAP was quickly sold off as short-term profit takers stepped in to cash in. 2. On the rise up past $78.00, the stock exceeded its June and August swing highs of 77.77 and 77.46. Normally, you'd think this was great news if you were bullish on the stock, and for the intermediate term it really is. But if you had simply bought at the open after witnessing it gap higher overnight by 6.8% right into two major resistance zones, that probably wasn't a great idea from a timing perspective. The reason why is that a strong gap higher (lower) into a widely watched resistance (support) area like a 50- or 200-day moving average will almost always pullback after making the first stage of the leap (plunge) higher (lower). Therefore, a trader looking to capitalize on a one- to two-week rally in SAP would have been well advised to wait for an intraday pullback during Monday's session before attempting to go long. Here are some common support levels at which you may find it an opportune place to launch a long entry after a stock significantly gaps up into a major resistance zone: 1. Look to enter long after an attempt by the stock to close or at least test the open gap created by the overnight surge higher. 2. Look for either the 21- or 50-period moving averages on a 15-minute intraday chart to act as meaningful support once the profit-taking is done. 3. Look for a combination of Fibonacci retracement levels to also act as intraday support, also on the 15-minute time frame. 4. Look for evidence that accumulation is happening during the intraday pullback and then wait for your usual mechanical entry trigger to fire your entry signal after a successful support test is complete. For longer term traders, those willing to invest four weeks of time into a long SAP trade, the entry timing isn't as critical, especially if they choose to play potential bullish follow-through with a November '13 covered call; the current daily chart pattern is a triple-top breakout, making it a great covered call setup. |

|
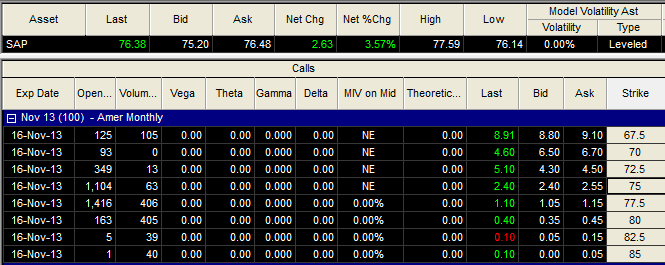
| Figure 2. The November '13 SAP $75.00 calls have healthy open interest and a decent bid/ask spread. |
| Graphic provided by: TradeStation. |
| Graphic provided by: TradeStation Options Analysis. |
| |
| Perhaps the easiest "no timing needed" bullish play in SAP now is to buy the November '13 SAP $75.00 covered call, looking to profit if the triple top breakout finally plays out, and with strong bullish follow through. SAP can and does trend well at times; its successful double top breakout in November 2012 saw the shares go from $74 to $82 in six weeks, and a 21-day simple moving average did a good job of keeping swing and/or covered call traders in the trade, allowing some back and fill action until final stop out or calling away of the shares in December 2012. The $75 call has healthy open interest of 1,104 contracts and a decent bid/ask spread; if taking this covered call, be sure to limit your account risk to 1% and be willing to hold the position until November '13 options expiration on November 15th. As always, trade wisely until we meet here again. |
Freelance financial markets writer and online publisher of the Trendzetterz.com S&P 500 Weekly Forecast service.
| Title: | Market consultant and writer |
| Company: | Trendzetterz |
| Address: | 81 Hickory Hollow Drive |
| Crossville, TN 38555 | |
| Phone # for sales: | 904-303-4814 |
| Website: | trendzetterz.com |
| E-mail address: | support@trendzetterz.com |
Traders' Resource Links | |
| Trendzetterz has not added any product or service information to TRADERS' RESOURCE. | |
Click here for more information about our publications!
PRINT THIS ARTICLE

Request Information From Our Sponsors
- StockCharts.com, Inc.
- Candle Patterns
- Candlestick Charting Explained
- Intermarket Technical Analysis
- John Murphy on Chart Analysis
- John Murphy's Chart Pattern Recognition
- John Murphy's Market Message
- MurphyExplainsMarketAnalysis-Intermarket Analysis
- MurphyExplainsMarketAnalysis-Visual Analysis
- StockCharts.com
- Technical Analysis of the Financial Markets
- The Visual Investor
- VectorVest, Inc.
- Executive Premier Workshop
- One-Day Options Course
- OptionsPro
- Retirement Income Workshop
- Sure-Fire Trading Systems (VectorVest, Inc.)
- Trading as a Business Workshop
- VectorVest 7 EOD
- VectorVest 7 RealTime/IntraDay
- VectorVest AutoTester
- VectorVest Educational Services
- VectorVest OnLine
- VectorVest Options Analyzer
- VectorVest ProGraphics v6.0
- VectorVest ProTrader 7
- VectorVest RealTime Derby Tool
- VectorVest Simulator
- VectorVest Variator
- VectorVest Watchdog
