

HOT TOPICS LIST
- MACD
- Fibonacci
- RSI
- Gann
- ADXR
- Stochastics
- Volume
- Triangles
- Futures
- Cycles
- Volatility
- ZIGZAG
- MESA
- Retracement
- Aroon
INDICATORS LIST
LIST OF TOPICS
PRINT THIS ARTICLE
by Koos van der Merwe
A share to keep an eye on, but is it due for a correction?
Position: Buy
Koos van der Merwe
Has been a technical analyst since 1969, and has worked as a futures and options trader with First Financial Futures in Johannesburg, South Africa.
PRINT THIS ARTICLE
ELLIOTT WAVE
Gilead Sciences, Inc.
10/22/13 04:35:29 PMby Koos van der Merwe
A share to keep an eye on, but is it due for a correction?
Position: Buy
| Gilead Sciences Inc. is a research based biopharmaceutical company specializing in research for HIV infection. |
|
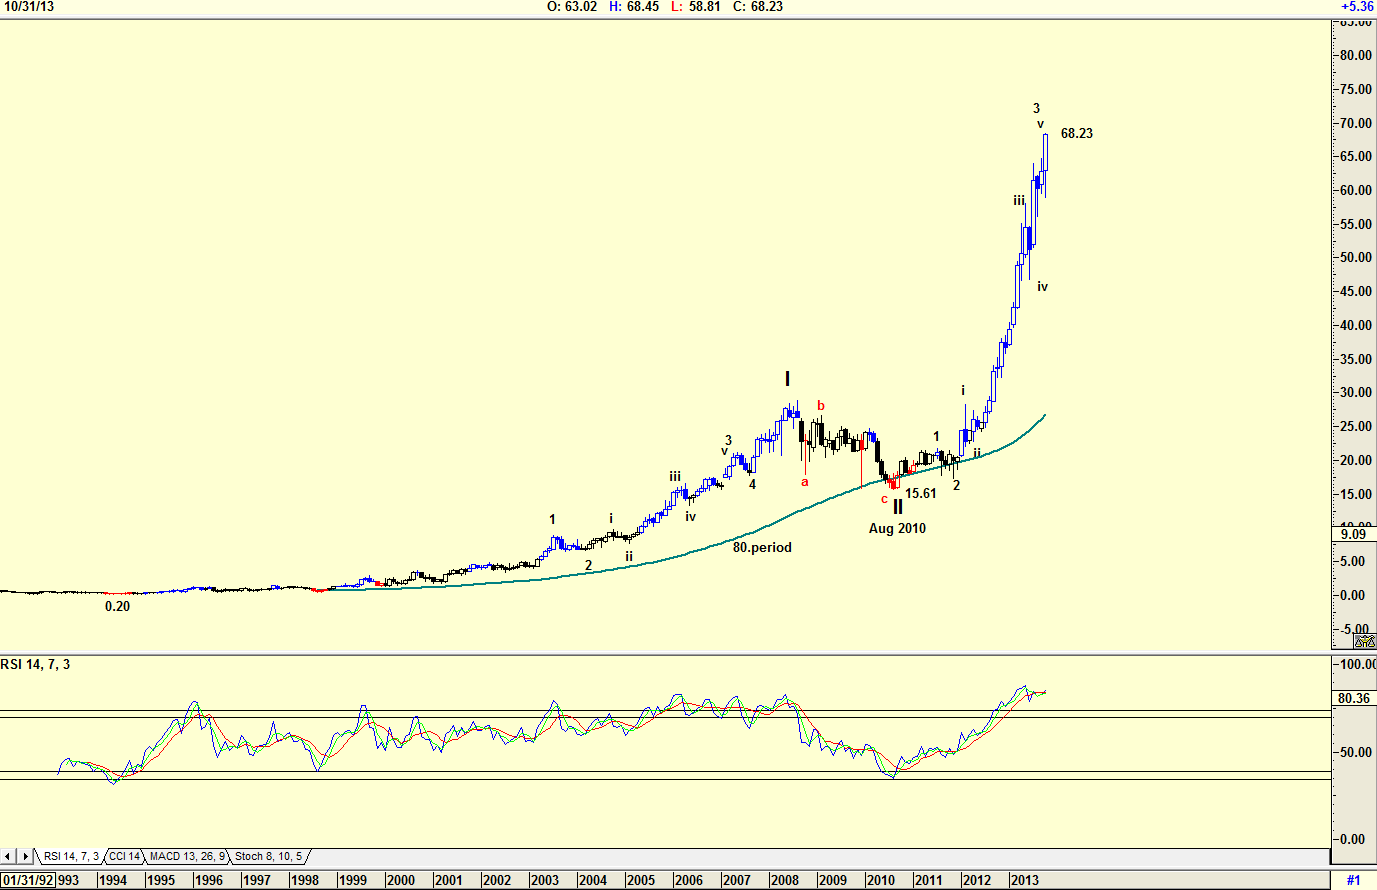
| Figure 1. Monthly chart of Gilead Sciences. |
| Graphic provided by: AdvancedGET. |
| |
| The monthly chart in Figure 1 shows an Elliott Wave count suggesting the share price could be due for a correction. The chart suggests that the share price could be completing a Wave 3 of WAVE III after rising logarithmically from August 2010 from $15.61 to its present $68.23. The RSI indicator is at overbought levels, and although it has not given a sell signal yet, it is suggesting that a sell is on the cards sometime in the future, possibly after a WAVE V has been completed. |
|
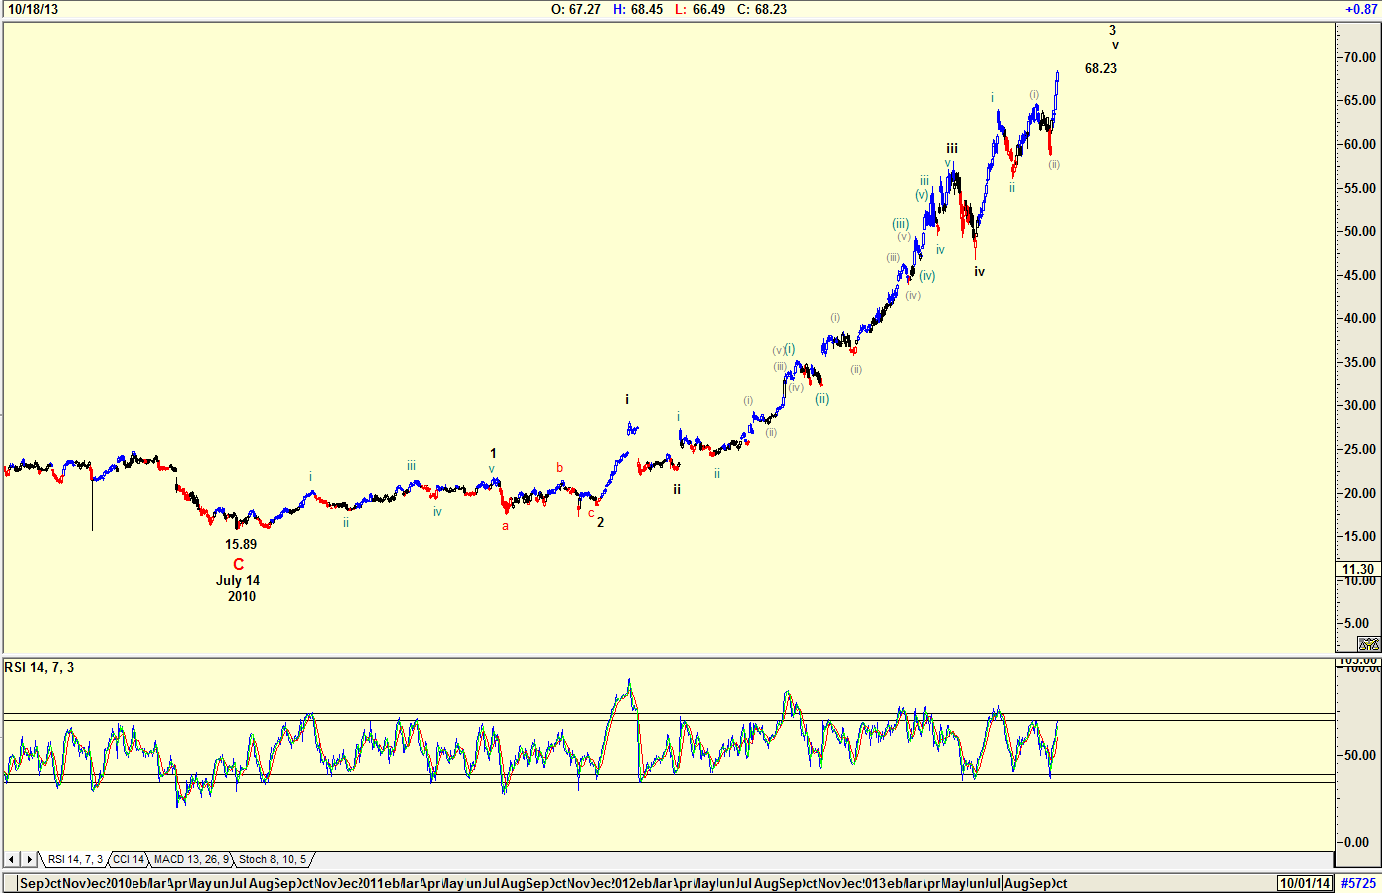
| Figure 2. Daily chart of Gilead Sciences. |
| Graphic provided by: AdvancedGET. |
| |
| The daily chart in Figure 2 shows an Elliott Wave count confirming the monthly count. The chart is suggesting that the wave count is in a wave (iii) of Wave iii of Wave V. The RSI is not in an overbought position suggesting that there is still upside. |
|
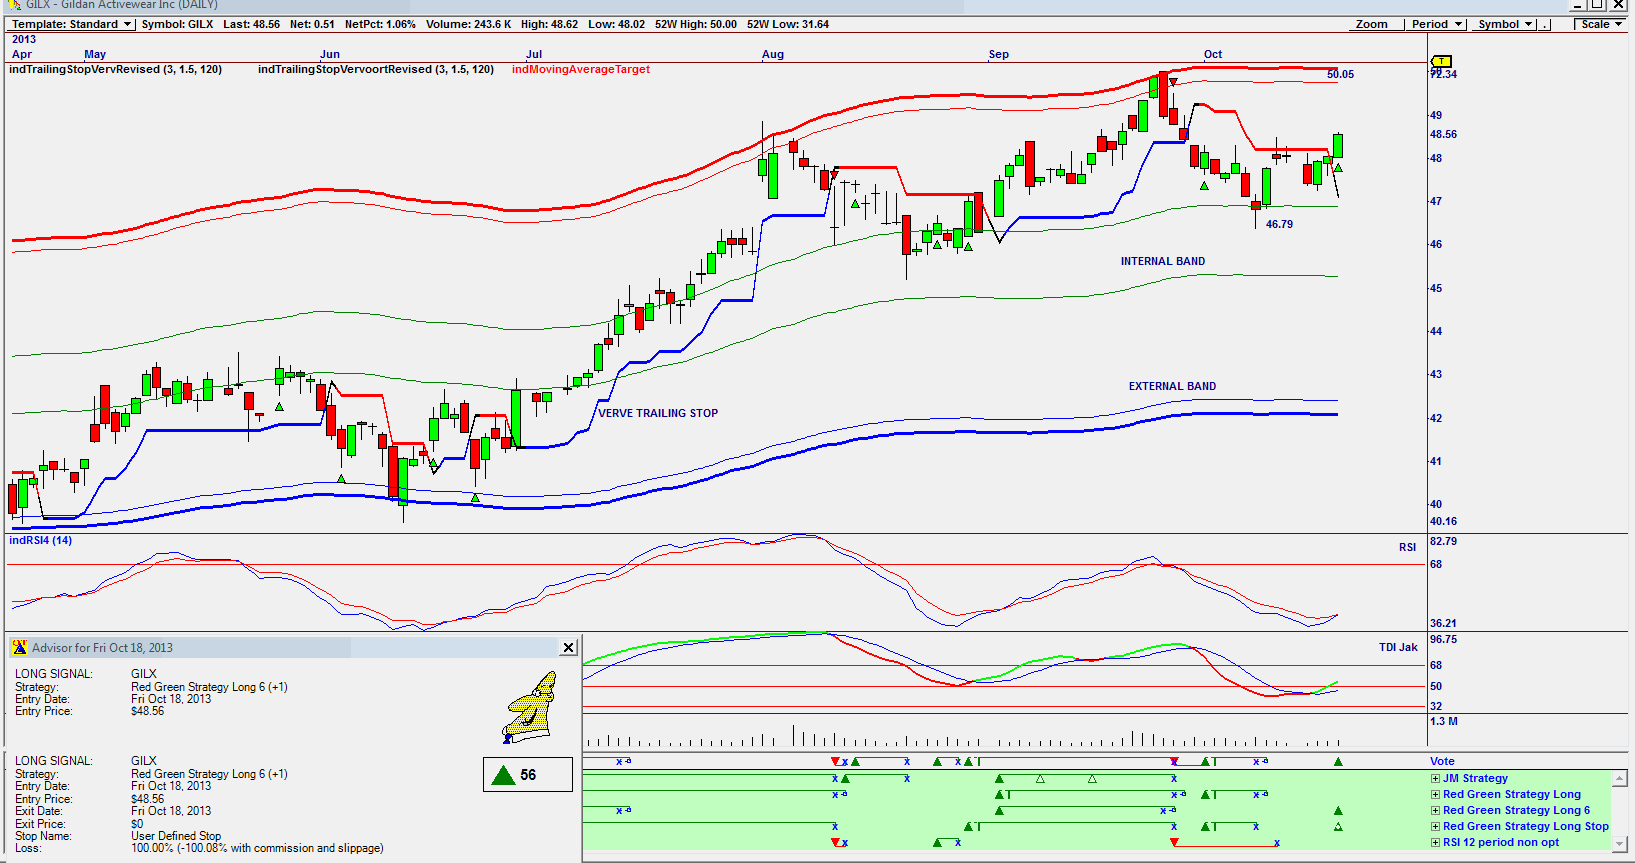
| Figure 3. Daily Omnitrader chart suggesting a strong BUY at present levels. |
| Graphic provided by: Omnitrader. |
| |
| The chart in Figure 3 is the one that brought the share to my attention. The Vote line on the chart has given a buy signal based on the Red Green strategy Long 6 and Long stop. The Advisor rating is 56, a strong rating, suggesting that you should buy the stock for a short-term profit. The RSI indicator and TDI Jak indicator are suggesting a buy. The upper band of the Internal Band indicator supported the price at $46.79, and with the share price breaking above the Verve Trailing stop, a buy signal is suggesting a target of $50.05, the upper band of the external band. I would be a buyer of Gilead Sciences, but for a short-term trade. However, on any correction to the lower band of the external band, I would be a buyer for the long-term. |
Has been a technical analyst since 1969, and has worked as a futures and options trader with First Financial Futures in Johannesburg, South Africa.
| Address: | 3256 West 24th Ave |
| Vancouver, BC | |
| Phone # for sales: | 6042634214 |
| E-mail address: | petroosp@gmail.com |
Click here for more information about our publications!
Comments
Date:�10/24/13Rank:�4Comment:�In this article there is mentioned the TDIJak indicator. Where can I find info on this indicator

Request Information From Our Sponsors
- StockCharts.com, Inc.
- Candle Patterns
- Candlestick Charting Explained
- Intermarket Technical Analysis
- John Murphy on Chart Analysis
- John Murphy's Chart Pattern Recognition
- John Murphy's Market Message
- MurphyExplainsMarketAnalysis-Intermarket Analysis
- MurphyExplainsMarketAnalysis-Visual Analysis
- StockCharts.com
- Technical Analysis of the Financial Markets
- The Visual Investor
- VectorVest, Inc.
- Executive Premier Workshop
- One-Day Options Course
- OptionsPro
- Retirement Income Workshop
- Sure-Fire Trading Systems (VectorVest, Inc.)
- Trading as a Business Workshop
- VectorVest 7 EOD
- VectorVest 7 RealTime/IntraDay
- VectorVest AutoTester
- VectorVest Educational Services
- VectorVest OnLine
- VectorVest Options Analyzer
- VectorVest ProGraphics v6.0
- VectorVest ProTrader 7
- VectorVest RealTime Derby Tool
- VectorVest Simulator
- VectorVest Variator
- VectorVest Watchdog