

HOT TOPICS LIST
- MACD
- Fibonacci
- RSI
- Gann
- ADXR
- Stochastics
- Volume
- Triangles
- Futures
- Cycles
- Volatility
- ZIGZAG
- MESA
- Retracement
- Aroon
INDICATORS LIST
LIST OF TOPICS
PRINT THIS ARTICLE
by Billy Williams
The market is taking off and this stock just setup for a big move you don't want to miss.
Position: Hold
Billy Williams
Billy Williams has been trading the markets for 27 years, specializing in momentum trading with stocks and options.
PRINT THIS ARTICLE
STRATEGIES
Buy Signal For AZO
10/21/13 04:54:50 PMby Billy Williams
The market is taking off and this stock just setup for a big move you don't want to miss.
Position: Hold
| After running up against resistance at 1710, the S&P 500 index (.SPX) broke through on the highest volume in the last 10 trading days on news that the government may have reached an agreement to end the latest federal shutdown. Since early August, price action in the market had been restricted to a tight trading range as it experienced a period of contraction just as the summer was ending. Now, that the market is buoyed by renewed investor enthusiasm, new opportunities are likely to follow. One stock in particular, Autozone Inc. (AZO), is already setting up to go higher and take the rest of the market with it. AZO is an auto parts retailer that specializes in catering to auto shops and do-it-yourself mechanics with stores all across the country. The company is blessed with solid management and strong per store sales that have helped its stock outperform the rest of its competitors. |
|
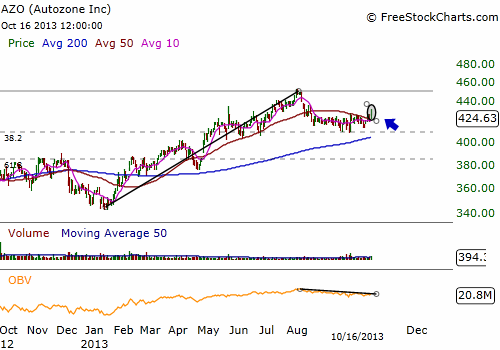
| Figure 1. AutoZone pulled back over the summer to its .382 Fib retracement level but is now showing signs of resuming its upward trend. In addition, the On Balance Volume indicator shows the stock is under accumulation and has begun to trade through its upper trendline showing the stock has investor support to go higher. |
| Graphic provided by: www.freestockcharts.com. |
| |
| AZO has been in a strong long-term bullish trend for years and only experienced brief periods of price contraction — in the 1990s and during the housing crash back in 2008. However, it has always shrugged off the bear's attempts to take its price down with the rest of the market, showing high amounts of relative strength. The stock declined earlier this year in January but regained its footing and traded back to an all-time high of $452 before pulling back to a .382 Fibonacci retracement level of around $414. This price level is generally considered a "shallow" retracement where price stands a strong chance of trading back to its previous high, and even trading beyond it. This retracement level is less than 10% away from its all-time high and is easily within reach of the bulls but AZO has other technical criteria that give the bulls a big edge in going beyond $452. |
|
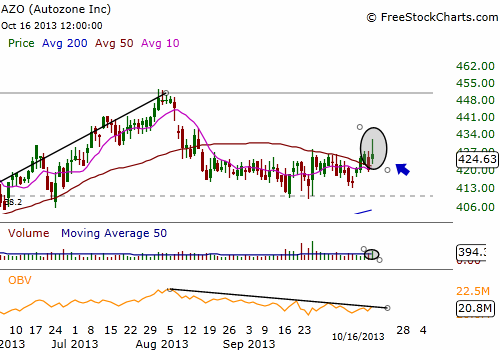
| Figure 2. Here you see a pocket pivot setup for a buy entry as the stock traded above the 10-day and 50-day SMA on higher volume than the previous 10 trading days. This is a low-risk entry that lets you get into the move early before a big move gets underway and helps keep you from chasing the move. |
| Graphic provided by: www.freestockcharts.com. |
| |
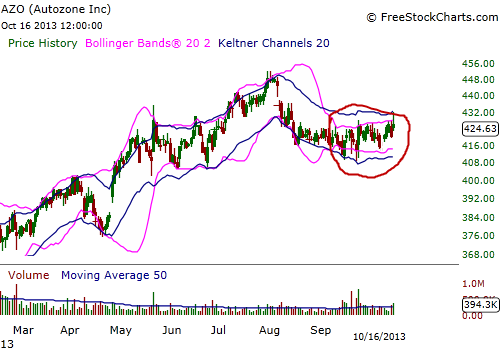
| First, AZO is in a "squeeze" where its Bollinger Bands are trading within its Keltner Channels. Bollinger Bands are based on the volatility of a stock while Keltner Channels are moving averages based on the price action. When the Bollinger Bands contract within the Keltner Channels, it means that volatility is falling, and that is followed by a rise in volatility since volatility always reverts to its mean. Bottom line, AZO's price action should explode higher as its price action reverts from low-volatility back to high volatility. In addition, there is a pocket pivot buy signal that fired off on October 16, 2013 which gives you the chance to enter early before the stock trades higher. |
|
| Figure 3. Also, AZO is in a "squeeze" as the Bollinger Bands are trading within its Keltner Channels. This condition occurs right before an explosive move occurs as price volatility transitions from low-volatility to high-volatility. |
| Graphic provided by: www.freestockcharts.com. |
| |
| A pocket pivot is marked by trading up through and closing over either its 10-day or 50-day SMA on volume higher than any of the down volume days within a 10-day window. So, if price closes over one or both of those SMA's as well as experience a rise in volume greater than any of the down volume days in a 10-day window, you have a buy signal. The price bar of October 16, 2013 closed over the 10-day and 50-day SMA under the other trade setup conditions, signaling a long entry. You can buy the stock or, better, buy the in-the-money December 420 call options which are priced around $17.80. They're cheaper than buying the stock which would set you back $42,400 for 100 shares whereas one call option at $1,780 lets you control the same amount of stock up to December expiration. This gives you much better leverage and better control over your risk. |
Billy Williams has been trading the markets for 27 years, specializing in momentum trading with stocks and options.
| Company: | StockOptionSystem.com |
| E-mail address: | stockoptionsystem.com@gmail.com |
Traders' Resource Links | |
| StockOptionSystem.com has not added any product or service information to TRADERS' RESOURCE. | |
Click here for more information about our publications!
PRINT THIS ARTICLE

Request Information From Our Sponsors
- StockCharts.com, Inc.
- Candle Patterns
- Candlestick Charting Explained
- Intermarket Technical Analysis
- John Murphy on Chart Analysis
- John Murphy's Chart Pattern Recognition
- John Murphy's Market Message
- MurphyExplainsMarketAnalysis-Intermarket Analysis
- MurphyExplainsMarketAnalysis-Visual Analysis
- StockCharts.com
- Technical Analysis of the Financial Markets
- The Visual Investor
- VectorVest, Inc.
- Executive Premier Workshop
- One-Day Options Course
- OptionsPro
- Retirement Income Workshop
- Sure-Fire Trading Systems (VectorVest, Inc.)
- Trading as a Business Workshop
- VectorVest 7 EOD
- VectorVest 7 RealTime/IntraDay
- VectorVest AutoTester
- VectorVest Educational Services
- VectorVest OnLine
- VectorVest Options Analyzer
- VectorVest ProGraphics v6.0
- VectorVest ProTrader 7
- VectorVest RealTime Derby Tool
- VectorVest Simulator
- VectorVest Variator
- VectorVest Watchdog