

HOT TOPICS LIST
- MACD
- Fibonacci
- RSI
- Gann
- ADXR
- Stochastics
- Volume
- Triangles
- Futures
- Cycles
- Volatility
- ZIGZAG
- MESA
- Retracement
- Aroon
INDICATORS LIST
LIST OF TOPICS
PRINT THIS ARTICLE
by Donald W. Pendergast, Jr.
Shares of SanDisk are surging higher again, making a near-term covered call play attractive.
Position: N/A
Donald W. Pendergast, Jr.
Freelance financial markets writer and online publisher of the Trendzetterz.com S&P 500 Weekly Forecast service.
PRINT THIS ARTICLE
BREAKOUTS
SanDisk: Surging To New Highs
10/18/13 12:27:46 PMby Donald W. Pendergast, Jr.
Shares of SanDisk are surging higher again, making a near-term covered call play attractive.
Position: N/A
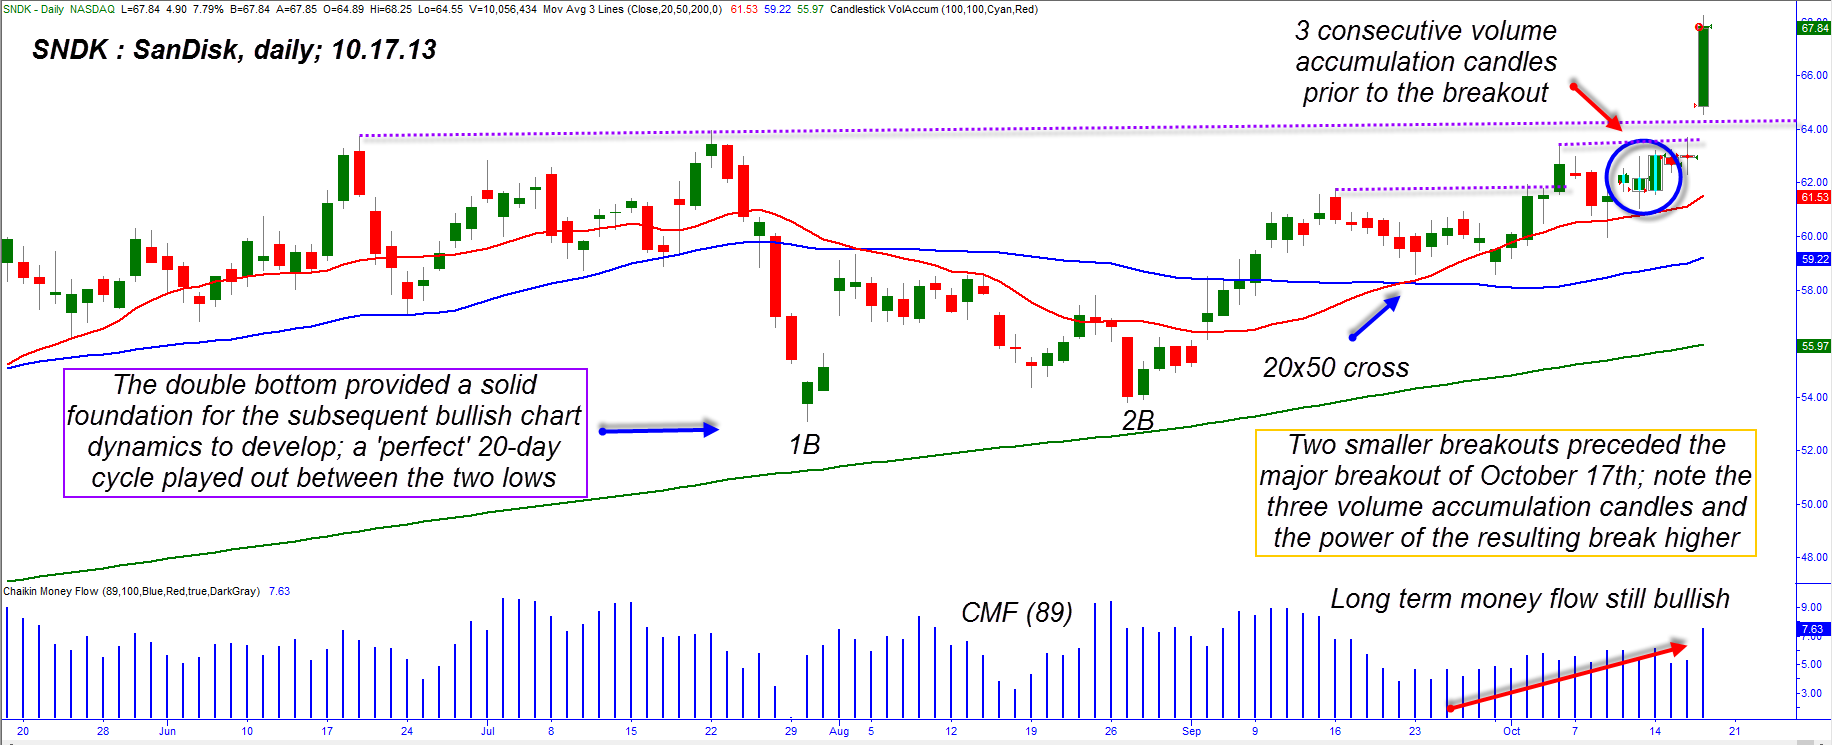
| Technical analysis or chart reading may be as much art as it is a science, but every once in a while a series of chart patterns appear that make the pathway to intelligent trading an objective pursuit. Here's a look at the technical development that preceded Thursday's massive bullish breakout in shares of SanDisk (SNDK). |
|
| Figure 1. Typically, bullish setups that successfully break higher will tend to have solid follow-through in the weeks after the breakout; a near-term covered call is one way to attempt to profit from subsequent gains. |
| Graphic provided by: TradeStation. |
| |
| Taken out of a broader technical and fundamental analysis context, the appearance of a sudden bullish or bearish breakout can sometimes leave investors and traders wondering just what caused such a rapid markup or markdown in the valuation of a particular stock. Here's a general workflow that may help you better understand the technical/fundamental dynamics involved prior to a major price breakout/breakdown: 1. A stock has a strong trend of positive earning surprises, with the few earnings misses generally being small. 2. After a proportional correction against an existing bullish trend, look to see if the long-term money flow trend is still above its zero line. A stock trading above its upsloping 200-day moving average is generally considered to be in a long-term uptrend. 3. If the stock continues higher after the correction and has tested support successfully (as did SNDK with this summer's double bottom pattern, look to see if the money flow trend remains bullish and for further upside momentum confirmation. SNDK's money flow trend stayed strong before and after the stock managed a bullish 20- and 50-day moving average crossover. 4. Once such a MA crossover occurs, it's typical to see another pullback to either the 20- or 50-day MA; a breakout back above the crossover bar high is a bullish sign, and that's just what SNDK accomplished in early October 2013. 5. SNDK then paused for a few more bars, but the bright blue candles (three in a row) are all volume accumulation candles (available in the Trade Station 9.1 Activity Bar window) and were yet another sign that the "smart money" was planning to mark SNDK higher within the next few sessions. And mark it up they did, gapping the stock dramatically higher at the start of trading on Thursday October 17, 2013. As of this writing the stock is up nearly 9% since Wednesday's close and is finishing out the session with yet another intraday surge to new highs. That all events occurred in sequence and not as isolated, "random" events would have led a skilled technician to conclude that SNDK was indeed destined for higher prices — especially once the second of the three breakouts occurred — even if the exact timing was not discernible. |
|
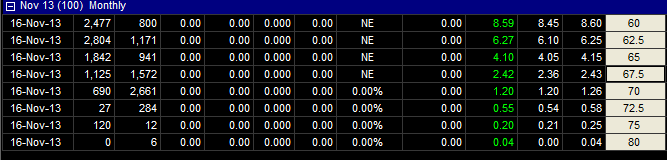
| Figure 2. The Nov. '13 SNDK 67.50 calls have good open interest and a close bid-ask spread. Expiration is 31 days away from Thursday October 17, 2013. |
| Graphic provided by: TradeStation. |
| Graphic provided by: TradeSTation OptionAnalysis. |
| |
| The big question for those who weren't pre-positioned for the big bullish gap is whether the stock is still an attractive candidate, or if all of the "big money" has already been made. The answer is "yes" it's still a good long candidate, but only from a covered call perspective. High momentum breakouts like this typically have good follow-through potential — particularly if the long-term money flow trend is healthy — and SNDK should have little trouble making a move up into the 70.00 area by month end. However, there are going to be plenty of short-term profit takers looking to secure Thursday's gains, making buying at the open a risky proposition, so why not take a three to six week view on the stock, looking to lock in some more gains should SNDK head up into the lower 70.00 area — without worrying about getting shaken out prematurely? To do this, consider putting on a November '13 SNDK 67.50 covered call; open interest is excellent, you'll get about $230 cash for each call you sell against your 100-share lot of SNDK and the shares have an above-average probability of being called away by November expiration. The bid ask spread is only five cents, another small edge in your favor. To manage the position, simply trail it with a 21-day exponential moving average (EMA) and then sit back and wait for SNDK's powerful upside momentum and daily option time decay go to work in your favor. Should the trade fail — with a daily close below the EMA — simply close it down and walk away with a modest loss. Be sure to keep your account risk at 1% on this trade to help minimize the possibility of a near-term pullback in the US markets over the next few sessions. As always, trade wisely until we meet here again. |
Freelance financial markets writer and online publisher of the Trendzetterz.com S&P 500 Weekly Forecast service.
| Title: | Market consultant and writer |
| Company: | Trendzetterz |
| Address: | 81 Hickory Hollow Drive |
| Crossville, TN 38555 | |
| Phone # for sales: | 904-303-4814 |
| Website: | trendzetterz.com |
| E-mail address: | support@trendzetterz.com |
Traders' Resource Links | |
| Trendzetterz has not added any product or service information to TRADERS' RESOURCE. | |
Click here for more information about our publications!
PRINT THIS ARTICLE

Request Information From Our Sponsors
- StockCharts.com, Inc.
- Candle Patterns
- Candlestick Charting Explained
- Intermarket Technical Analysis
- John Murphy on Chart Analysis
- John Murphy's Chart Pattern Recognition
- John Murphy's Market Message
- MurphyExplainsMarketAnalysis-Intermarket Analysis
- MurphyExplainsMarketAnalysis-Visual Analysis
- StockCharts.com
- Technical Analysis of the Financial Markets
- The Visual Investor
- VectorVest, Inc.
- Executive Premier Workshop
- One-Day Options Course
- OptionsPro
- Retirement Income Workshop
- Sure-Fire Trading Systems (VectorVest, Inc.)
- Trading as a Business Workshop
- VectorVest 7 EOD
- VectorVest 7 RealTime/IntraDay
- VectorVest AutoTester
- VectorVest Educational Services
- VectorVest OnLine
- VectorVest Options Analyzer
- VectorVest ProGraphics v6.0
- VectorVest ProTrader 7
- VectorVest RealTime Derby Tool
- VectorVest Simulator
- VectorVest Variator
- VectorVest Watchdog