HOT TOPICS LIST
- MACD
- Fibonacci
- RSI
- Gann
- ADXR
- Stochastics
- Volume
- Triangles
- Futures
- Cycles
- Volatility
- ZIGZAG
- MESA
- Retracement
- Aroon
INDICATORS LIST
LIST OF TOPICS
PRINT THIS ARTICLE
by Koos van der Merwe
Groupon is a deal-of-the-day website that features discounted gift certificates usable at local or national companies. After hitting a high of $31.30 in November 2011, what went wrong?
Position: Buy
Koos van der Merwe
Has been a technical analyst since 1969, and has worked as a futures and options trader with First Financial Futures in Johannesburg, South Africa.
PRINT THIS ARTICLE
ELLIOTT WAVE
Groupon A Buy?
10/18/13 12:19:37 PMby Koos van der Merwe
Groupon is a deal-of-the-day website that features discounted gift certificates usable at local or national companies. After hitting a high of $31.30 in November 2011, what went wrong?
Position: Buy
| Groupon was launched in November 2008. By October 2010, Groupon served more than 150 markets in North America and 100 markets in Europe, Asia, and South America and had 35 million registered users. The idea for Groupon was created by Andrew Mason. In April 2010, the company was valued at $1.35 billion and the company was projecting that it was on pace to make $1 billion in sales faster than any other business. But things went wrong, its business model was a disaster. In its first earnings release as a public company, Groupon reported a 2011 fourth-quarter loss of $9.8 million on an adjusted basis, disappointing investors. It was only after Andrew Mason was replaced as CEO that the company started "becoming right" — another example of a "genius" not being a good businessman. |

|
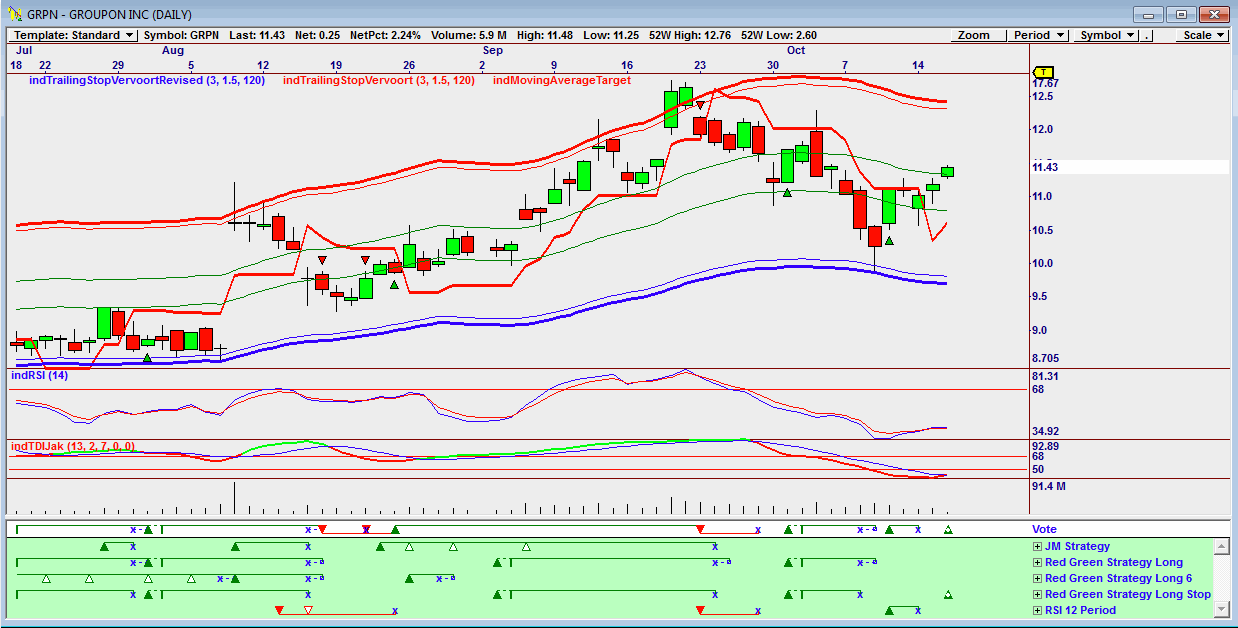
| Figure 1. Omnitrader chart showing Vote line buy signal. |
| Graphic provided by: Omnitrader. |
| |
| The chart in Figure 1 is an Omnitrader chart that gave a buy signal. The vote line buy was triggered by the strategy Red Green Strategy Long Stop as shown in green below the Vote line. The chart also suggests that the price could rise to the upper band at $12.33. This is confirmed by the two indicators shown on the chart, the 14-period RSI indicator and the TDIJak indicator which is also showing a buy. |

|
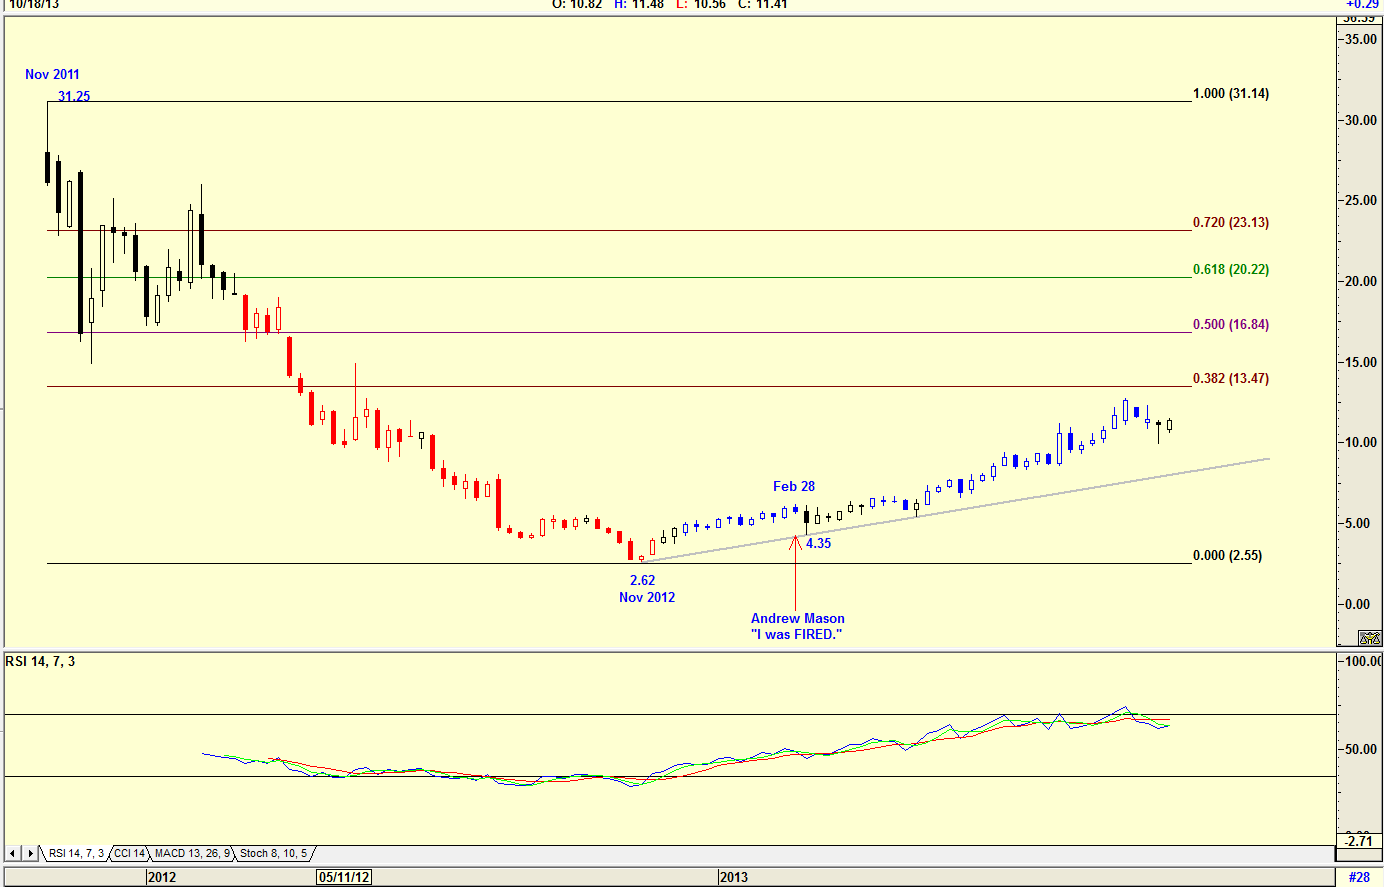
| Figure 2. Weekly chart showing collapse of share price. |
| Graphic provided by: AdvancedGET. |
| |
| The weekly chart in Figure 2 shows how the share price fell from a high of $31.25 in November 2011 to a low of $2.62 by November 2012. In February 2013, Andrew Mason made the following statement, "After four and a half intense and wonderful years as CEO of Groupon, I've decided that I'd like to spend more time with my family. Just kidding — I was fired today. If you're wondering why ... you haven't been paying attention." The chart shows that share price had started picking up from November, probably because the market anticipated that Mason would be replaced. Looking at the chart, you can see that price has retraced almost to 38.2% of its fall. However, the RSI indicator is suggesting a sell. So would you buy GRPN? Let us look at the daily chart in Figure 3 to verify the buy signal in Figure 1. |

|
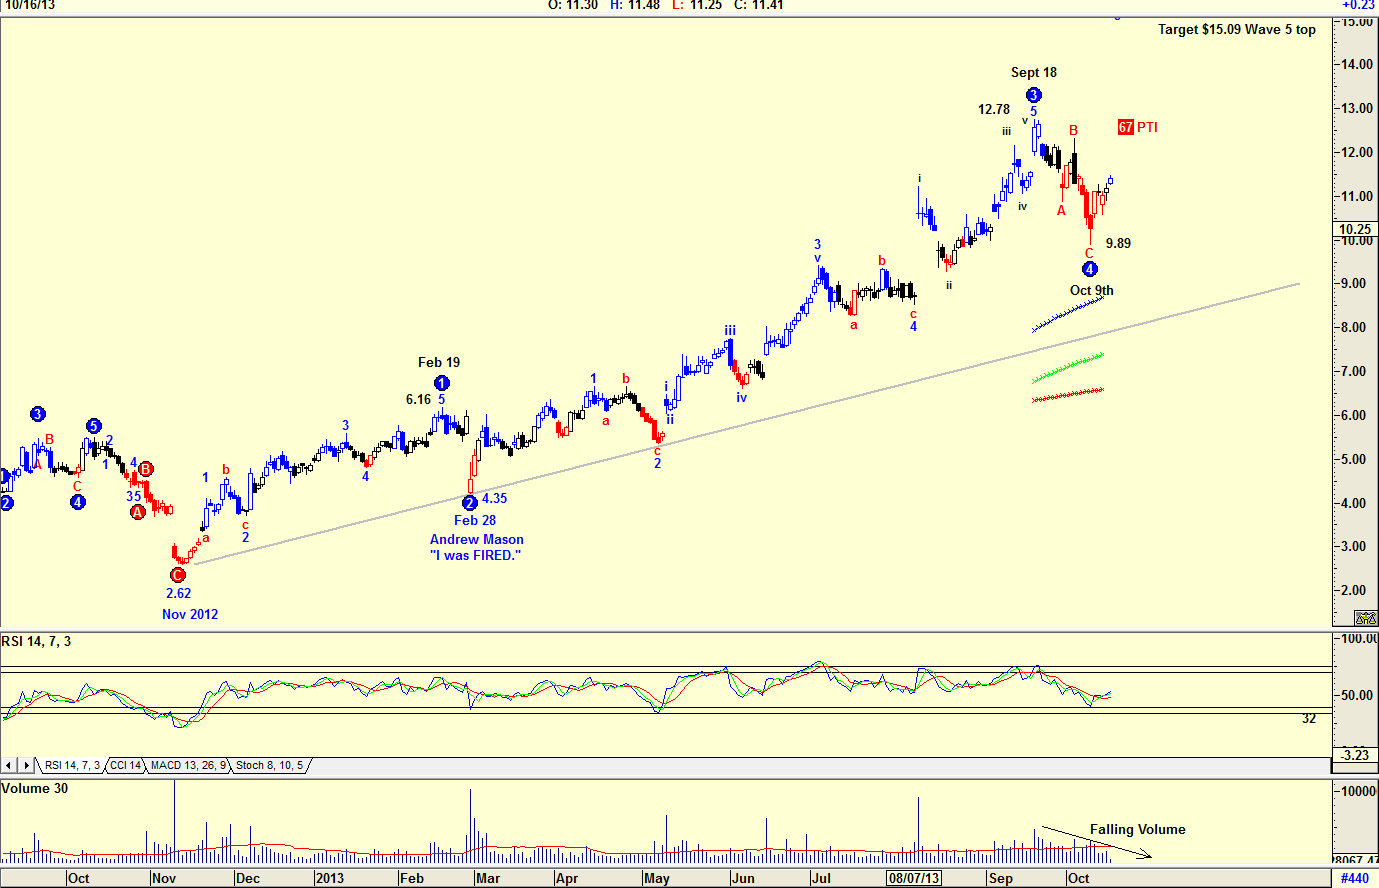
| Figure 3. Daily chart with Elliott wave count. |
| Graphic provided by: AdvancedGET. |
| |
| The chart in Figure 3 is a daily chart with an Elliott wave count. Note how Wave 1 topped out on February 19, 2013 at $6.16 with Wave 2 falling and bottoming when Andrew Mason announced that he had been replaced as CEO. From that date, the share price has slowly moved upwards, topping out on September 18, 2013 in Wave 3 at $12.78. The price then fell with market uncertainty caused by the conflict in the political scene in a Wave 4 to a low of $9.89 by October 9, 2013. The RSI indicator shown came close to suggesting a buy signal by moving below the 32 horizontal line. However, the Elliott wave count suggests that Wave 4 is complete, with a 67 PTI (Probability) that the price will now rise in a Wave 5. Volume however, is falling, suggesting that there may be further weakness ahead. A rise in price on falling volume suggests weakness. However, the argument that buyers stayed out of the market because of the recent political crises is valid. The rule "buy when everyone else is selling" should never be forgotten, and with my indicators suggesting a buy, I did purchase GRPN. The price I paid was $11.41, with a wave 5 target of $15.09. I will be happy if or when the target is reached. |
Has been a technical analyst since 1969, and has worked as a futures and options trader with First Financial Futures in Johannesburg, South Africa.
| Address: | 3256 West 24th Ave |
| Vancouver, BC | |
| Phone # for sales: | 6042634214 |
| E-mail address: | petroosp@gmail.com |
Click here for more information about our publications!
Comments

|

Request Information From Our Sponsors
- StockCharts.com, Inc.
- Candle Patterns
- Candlestick Charting Explained
- Intermarket Technical Analysis
- John Murphy on Chart Analysis
- John Murphy's Chart Pattern Recognition
- John Murphy's Market Message
- MurphyExplainsMarketAnalysis-Intermarket Analysis
- MurphyExplainsMarketAnalysis-Visual Analysis
- StockCharts.com
- Technical Analysis of the Financial Markets
- The Visual Investor
- VectorVest, Inc.
- Executive Premier Workshop
- One-Day Options Course
- OptionsPro
- Retirement Income Workshop
- Sure-Fire Trading Systems (VectorVest, Inc.)
- Trading as a Business Workshop
- VectorVest 7 EOD
- VectorVest 7 RealTime/IntraDay
- VectorVest AutoTester
- VectorVest Educational Services
- VectorVest OnLine
- VectorVest Options Analyzer
- VectorVest ProGraphics v6.0
- VectorVest ProTrader 7
- VectorVest RealTime Derby Tool
- VectorVest Simulator
- VectorVest Variator
- VectorVest Watchdog
