

HOT TOPICS LIST
- MACD
- Fibonacci
- RSI
- Gann
- ADXR
- Stochastics
- Volume
- Triangles
- Futures
- Cycles
- Volatility
- ZIGZAG
- MESA
- Retracement
- Aroon
INDICATORS LIST
LIST OF TOPICS
PRINT THIS ARTICLE
by Donald W. Pendergast, Jr.
Earnings really do matter, as the major plunge in Stanley Black & Decker shares clearly confirm.
Position: N/A
Donald W. Pendergast, Jr.
Freelance financial markets writer and online publisher of the Trendzetterz.com S&P 500 Weekly Forecast service.
PRINT THIS ARTICLE
GAPS
SWK: Earnings Miss Wipes Out Four-Month Rally
10/18/13 12:51:09 PMby Donald W. Pendergast, Jr.
Earnings really do matter, as the major plunge in Stanley Black & Decker shares clearly confirm.
Position: N/A
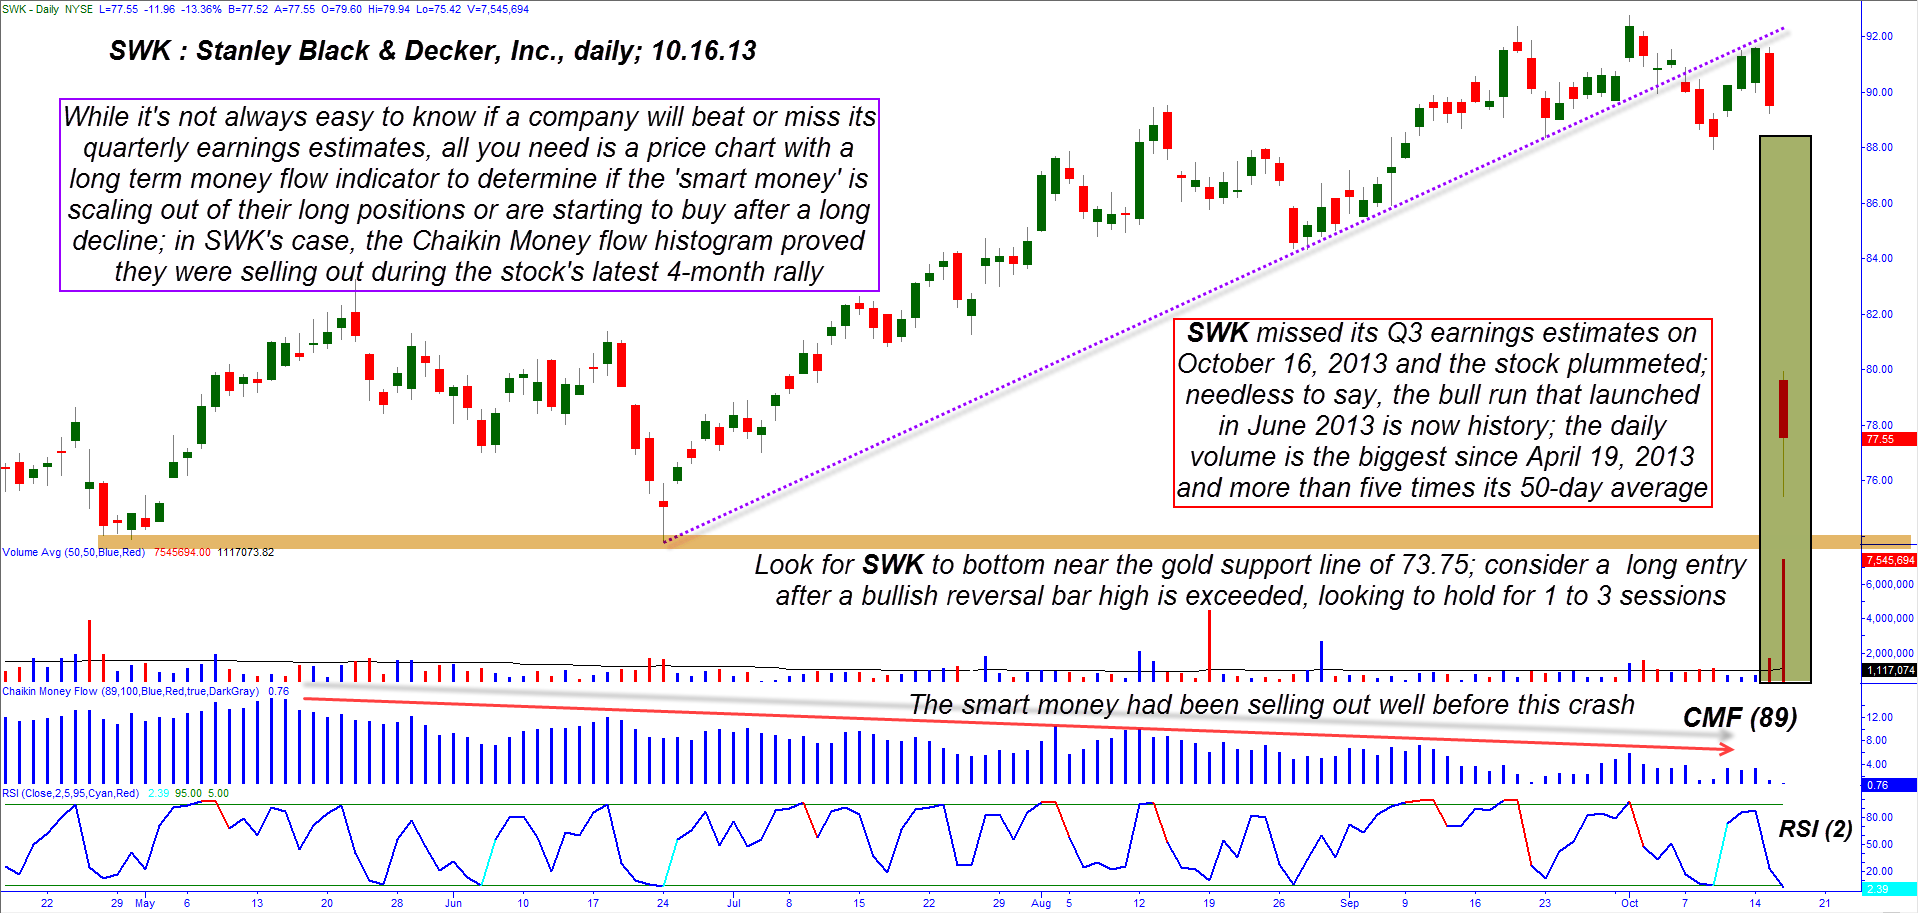
| The phrase "a miss is as good as a mile" has been proven true when it comes to Stanley Black & Decker, Inc. (SWK) share pricing; the company earned $1.39 per share in Q3 2013, missing the consensus estimate of $1.40 by a mere penny, and shareholders and traders responded by driving the stock down by nearly 14% in early morning trading on Wednesday October 16. And although absolutely no one knew how severe the decline would be if the earnings were shy of expectations, savvy traders could see that the "smart money" in SWK had been steadily selling out of their positions during the stock's most recent four-month long rally — a rally that is now history. Here's a closer look at SWK's daily chart (Figure 1), along with an idea on how to play a potential short-term bounce in the share price in the days/weeks ahead. |
|
| Figure 1. Stanley Black & Decker had given ample notice that a correction — depth and severity unknown — was going to be seen well in advance of Wednesday's shock sell-off. The 89-day Chaikin Money flow histogram did an excellent job of preparing wise traders/investors that the "smart money" was selling out all the way up since June 2013. |
| Graphic provided by: TradeStation. |
| |
| Long-term shareholders of SWK were no doubt upset to learn that the stock — one with one of the best multi-decade history of dividend payouts — had plunged by 14% in the morning session of trading on October 16, 2012. The stock missed Q3 2013 consensus earnings by a mere penny, but that wasn't the real catalyst to unleash such ferocious selling. No the "big deal" here is that the company also lowered its FY (fiscal year) 2013 earnings per share (EPS) guidance from a range of $5.40 to $5.65 down to $4.90 to $5.00, which is nearly 10%; that's the real precipitating event for this "unexpected" selloff. But for those using technical analysis, the use of a simple, yet reliable money flow indicator would have warned traders well in advance of a significant sell-off. That indicator is the 89-day Chaikin Money flow (CMF)(89) histogram. As you glance at it you witness how it continued to trend ever lower even as SWK rallied between mid-June and early October 2013. And even though the indicator couldn't tell a trader/investor "exactly" when the sell-off would hit, it at least gave existing longs plenty of time to scale out of and/or buy put option protection to help guard against the ravages of a sudden decline. As this is written the daily volume is more than five times the 50-day average trading volume, which is a major confirmation that the bull market in SWK — at least the most recent phase of it — is now over and done. |
|
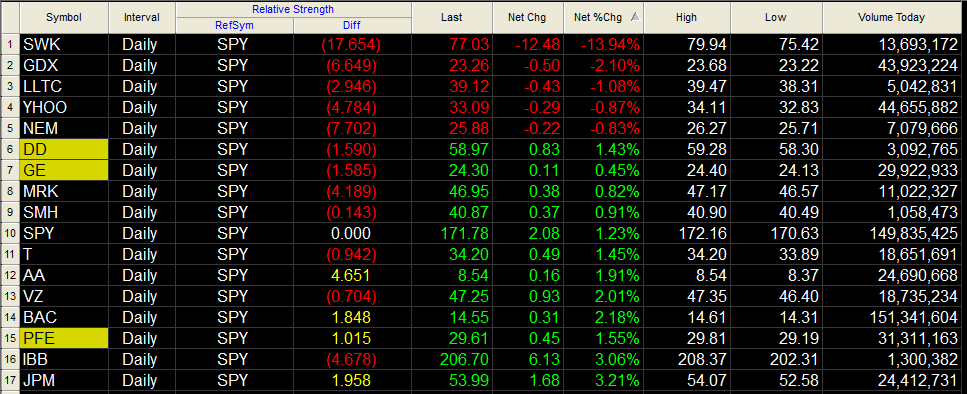
| Figure 2. SWK fared far worse than the vast majority of large caps and large-cap ETFs after the company lowered FY 2013 EPS estimates by 10%. |
| Graphic provided by: TradeStation. |
| Graphic provided by: TradeStation RadarScreen. |
| |
| At the moment, it's too early to discern whether or not SWK will bottom out near the gold support area near $73.75, but since that level has been the foundation for two previous nulticycle lows, it's a pretty safe bet to assume that SWK will indeed find support there again; since most shock sell-offs like this one will have a short-covering bounce at some point, the 73.75 area is as good as any for the realization of such a minor rally. Here's what to look for: 1. SWK bottoms out between 73.00 and 74.00, forming a bullish reversal bar as it rises from the lows. 2. The high of such a reversal bar is exceeded by about 10 ticks (.10). Once the high is exceeded, it's time to go long in anticipation that many shorts will begin to cover, potentially driving SWK higher for several trading sessions. One of the best ways to know when to exit on a "bounce" play is to identify the key 200-day moving average support and Fibonacci retracement levels on a 60-minute chart, looking for signs of exhaustion as the bounce plays out. Bounces initiated by short covering after a nasty decline tend to be fast and violent, so be sure to aggressively protect profits and keep your account risk low — preferably no more than 1% on this anticipated trade setup. Every day stocks miss earnings estimates and make big moves up or down, so learn to identify them and to capitalize on such extreme gyrations in price. Trade wisely until we meet here again. |
Freelance financial markets writer and online publisher of the Trendzetterz.com S&P 500 Weekly Forecast service.
| Title: | Market consultant and writer |
| Company: | Trendzetterz |
| Address: | 81 Hickory Hollow Drive |
| Crossville, TN 38555 | |
| Phone # for sales: | 904-303-4814 |
| Website: | trendzetterz.com |
| E-mail address: | support@trendzetterz.com |
Traders' Resource Links | |
| Trendzetterz has not added any product or service information to TRADERS' RESOURCE. | |
Click here for more information about our publications!
PRINT THIS ARTICLE

Request Information From Our Sponsors
- StockCharts.com, Inc.
- Candle Patterns
- Candlestick Charting Explained
- Intermarket Technical Analysis
- John Murphy on Chart Analysis
- John Murphy's Chart Pattern Recognition
- John Murphy's Market Message
- MurphyExplainsMarketAnalysis-Intermarket Analysis
- MurphyExplainsMarketAnalysis-Visual Analysis
- StockCharts.com
- Technical Analysis of the Financial Markets
- The Visual Investor
- VectorVest, Inc.
- Executive Premier Workshop
- One-Day Options Course
- OptionsPro
- Retirement Income Workshop
- Sure-Fire Trading Systems (VectorVest, Inc.)
- Trading as a Business Workshop
- VectorVest 7 EOD
- VectorVest 7 RealTime/IntraDay
- VectorVest AutoTester
- VectorVest Educational Services
- VectorVest OnLine
- VectorVest Options Analyzer
- VectorVest ProGraphics v6.0
- VectorVest ProTrader 7
- VectorVest RealTime Derby Tool
- VectorVest Simulator
- VectorVest Variator
- VectorVest Watchdog