

HOT TOPICS LIST
- MACD
- Fibonacci
- RSI
- Gann
- ADXR
- Stochastics
- Volume
- Triangles
- Futures
- Cycles
- Volatility
- ZIGZAG
- MESA
- Retracement
- Aroon
INDICATORS LIST
LIST OF TOPICS
PRINT THIS ARTICLE
by Donald W. Pendergast, Jr.
Down by nearly 65% since November 2011, shares of Newmont Mining look to be close to a bullish reversal zone.
Position: N/A
Donald W. Pendergast, Jr.
Freelance financial markets writer and online publisher of the Trendzetterz.com S&P 500 Weekly Forecast service.
PRINT THIS ARTICLE
REVERSAL
Newmont Mining: Approaching Cyle Low?
10/16/13 04:28:01 PMby Donald W. Pendergast, Jr.
Down by nearly 65% since November 2011, shares of Newmont Mining look to be close to a bullish reversal zone.
Position: N/A
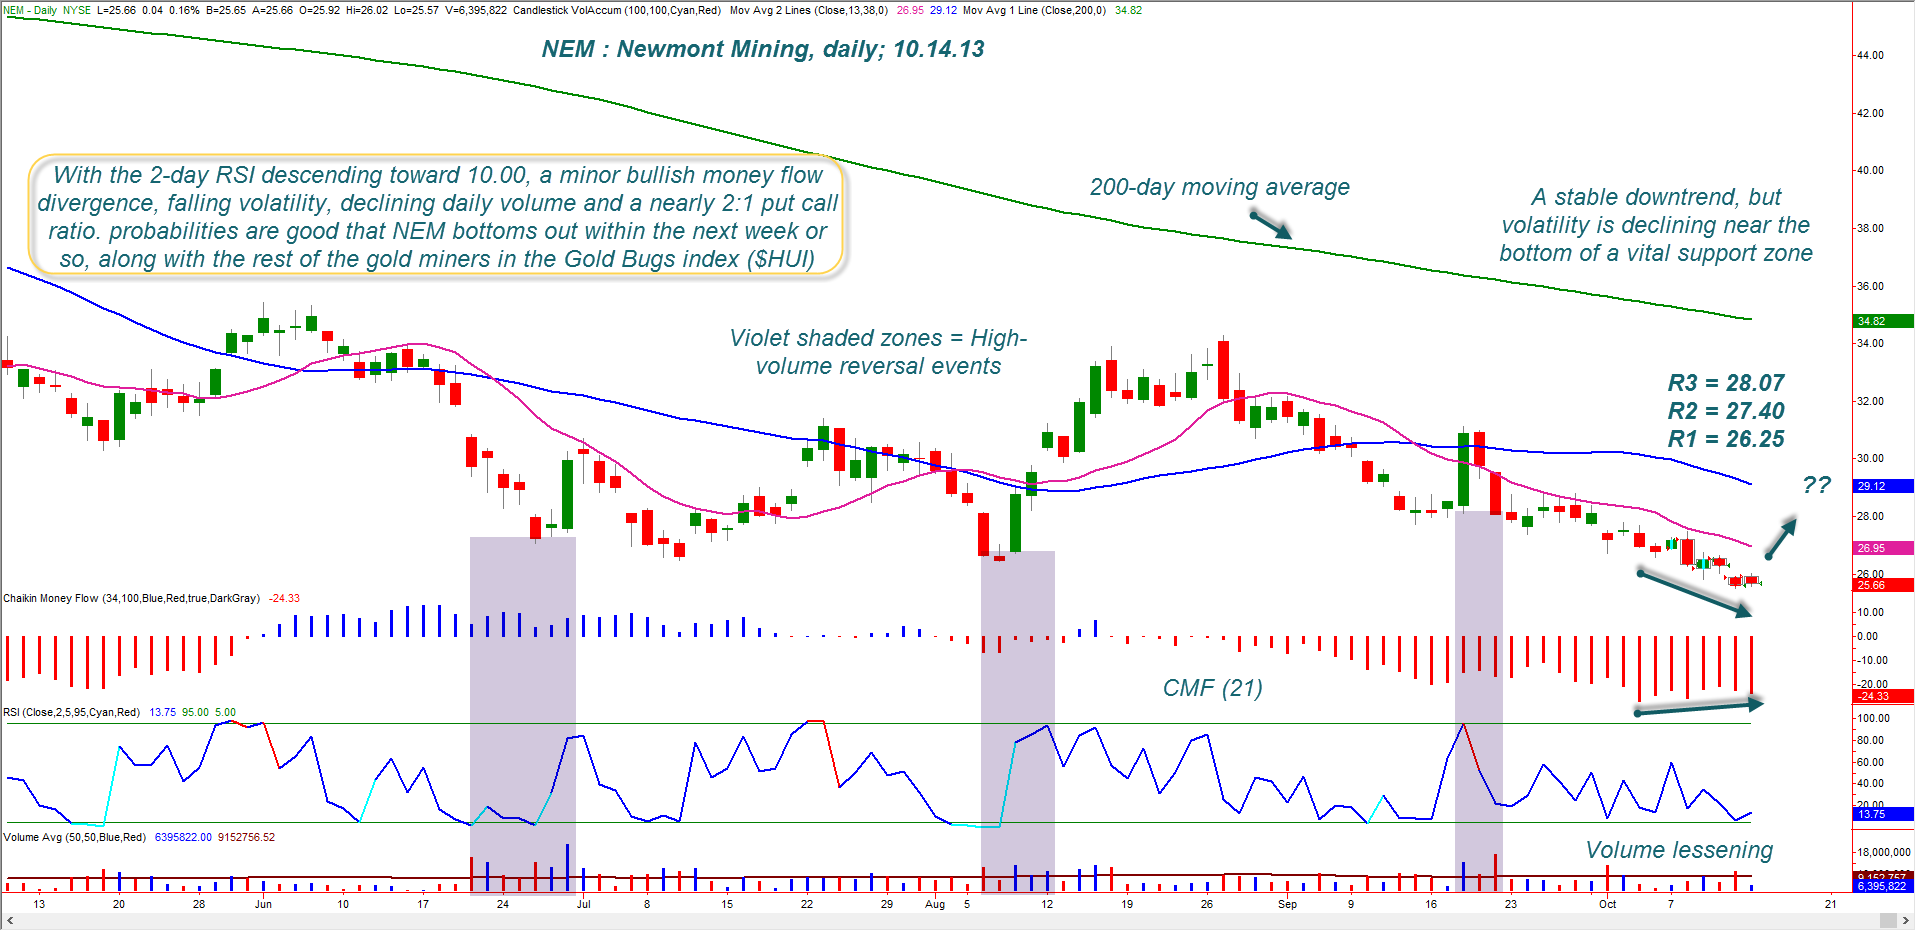
| Gold mining stocks have really taken a hit over the past two years after peaking during 2011's massive rally to all-time highs. One of the premier large caps among the gold miners is Newmont Mining (NEM), based in Denver Colorado, and since it has a high correlation with the gold bugs index ($HUI), once it turns higher, its entire industry group should rise in sympathy. Here's a closer look at NEM's daily chart (Figure 1). |
|
| Figure 1. Newmont Mining's volatility and volume have both been shrinking, even as a minor price/money flow divergence has appeared on its daily chart. Expect a period of high-volume/volatility to erupt soon. |
| Graphic provided by: TradeStation. |
| |
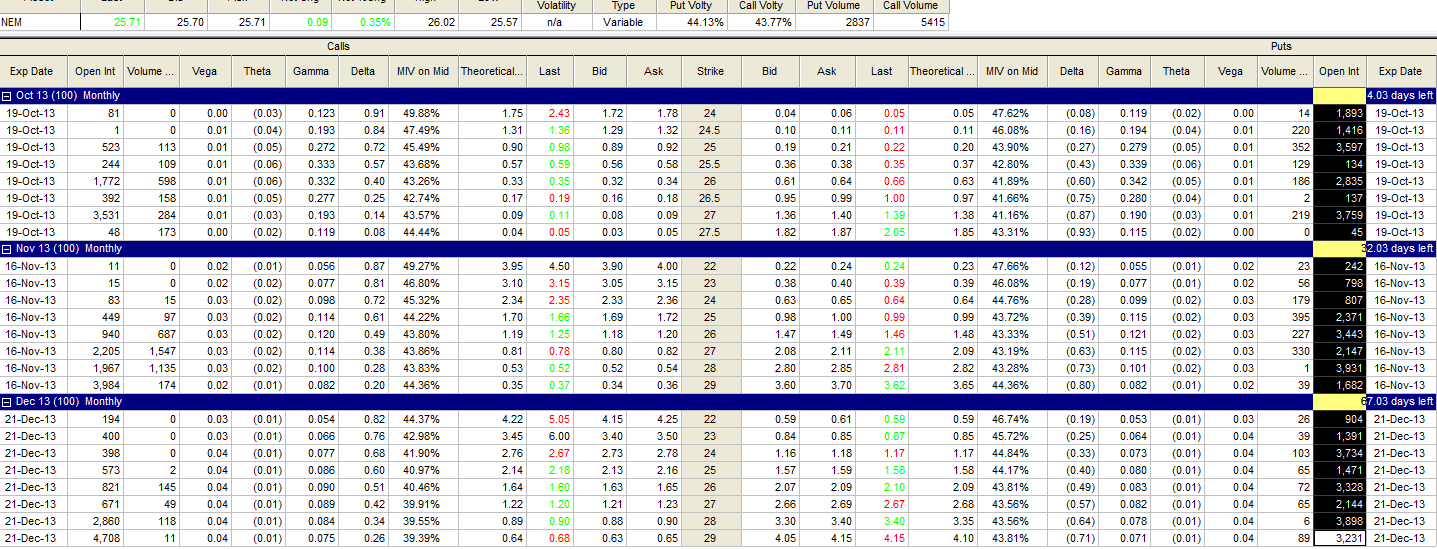
| When an entire industry group goes south in the stock market — and persists in its ability to decline over a sustained period of time — it's easy to understand how investor sentiment will invariably become ultra-pessimistic during the final phase of the decline into a tradable bullish reversal. In the case of NEM, sentiment is bearish now, judging from the put/call ratios in the October, November, and December 2013 options in NEM: October put/call ratio = 2.10 November put/call ratio = 1.60 December put/call ratio = 1.89 This simply means that investors/traders still have a decidedly bearish bias for NEM until at least December 21, 2013 and that means that this can also be used as a contrarian (in this case bullish) indicator, provided that NEM is starting to exhibit signs of downside exhaustion. There are several tell-tale clues that suggest that NEM may be closing in an a daily nulticycle cycle low in the next week or two: 1. The 10-, 20- and 40-day cycles are all expected to bottom within the same general time window sometime during the middle of this month. 2. The 21-day Chaikin Money flow histogram (CMF)(21) is manifesting a bullish divergence with price. 3. NEM is making repeated — and successful — support tests on its intraday 10-minute chart as of late session trading on Monday October 14, 2013, which is another sign that the "smart money" may be starting to "nibble" once again at this large cap miner's shares. 4. NEM has overshot its June 2013 low of 26.43, but has done so on lower volumes, another clue that the fear factor has begun to subside in the stock. 5. Volatility (average daily price ranges) and average daily volume have been declining in NEM, suggesting that the current selling wave is close to an end. 6. The two-day RSI is getting down near the 10.00 area again; another dip below it, followed by a bullish reversal bar might be all that's needed to get the bulls charging once again in NEM. |
|
| Figure 2. Put option open interest (OI) in NEM is approximately double that of call option OI for the three nearest monthly expirations. |
| Graphic provided by: TradeStation. |
| Graphic provided by: TradeStation Option Analysis. |
| |
| As far as looking to take a long position in NEM, look no further than item number six in the list — watch for the RSI to bottom (a dip down toward 5.00) followed by a wide-range bullish reversal bar to indicate that a low-risk entry can be contemplated. Once the high of the reversal bar is exceeded, go long, risking no more than 1% of your account equity. Set your stop a few ticks blow the reversal bar and then look to scale out of your position should the stock approach any of these three resistance levels: R1 = 26.25 R2 = 27.40 R3 = 28.07 Those are the three most solid resistance zones, based on the current daily chart structures in NEM, and a wise trader will certainly take profits at each one, should NEM advance that far on this anticipated reversal. Be aware that a settlement of the Federal budget mess/debt ceiling debacle will almost certainly add to NEM's trading volatility in the next week, so be prepared for the unexpected — mostly by using smaller than normal position sizes for this particular trade setup. Trade wisely until we meet here again. |
Freelance financial markets writer and online publisher of the Trendzetterz.com S&P 500 Weekly Forecast service.
| Title: | Market consultant and writer |
| Company: | Trendzetterz |
| Address: | 81 Hickory Hollow Drive |
| Crossville, TN 38555 | |
| Phone # for sales: | 904-303-4814 |
| Website: | trendzetterz.com |
| E-mail address: | support@trendzetterz.com |
Traders' Resource Links | |
| Trendzetterz has not added any product or service information to TRADERS' RESOURCE. | |
Click here for more information about our publications!
Comments
Date:�10/16/13Rank:�3Comment:�
Date:�10/16/13Rank:�5Comment:�

Request Information From Our Sponsors
- StockCharts.com, Inc.
- Candle Patterns
- Candlestick Charting Explained
- Intermarket Technical Analysis
- John Murphy on Chart Analysis
- John Murphy's Chart Pattern Recognition
- John Murphy's Market Message
- MurphyExplainsMarketAnalysis-Intermarket Analysis
- MurphyExplainsMarketAnalysis-Visual Analysis
- StockCharts.com
- Technical Analysis of the Financial Markets
- The Visual Investor
- VectorVest, Inc.
- Executive Premier Workshop
- One-Day Options Course
- OptionsPro
- Retirement Income Workshop
- Sure-Fire Trading Systems (VectorVest, Inc.)
- Trading as a Business Workshop
- VectorVest 7 EOD
- VectorVest 7 RealTime/IntraDay
- VectorVest AutoTester
- VectorVest Educational Services
- VectorVest OnLine
- VectorVest Options Analyzer
- VectorVest ProGraphics v6.0
- VectorVest ProTrader 7
- VectorVest RealTime Derby Tool
- VectorVest Simulator
- VectorVest Variator
- VectorVest Watchdog