HOT TOPICS LIST
- MACD
- Fibonacci
- RSI
- Gann
- ADXR
- Stochastics
- Volume
- Triangles
- Futures
- Cycles
- Volatility
- ZIGZAG
- MESA
- Retracement
- Aroon
INDICATORS LIST
LIST OF TOPICS
PRINT THIS ARTICLE
by Koos van der Merwe
"We're a year and change into Meg Whitman's reign atop Hewlett-Packard (HPQ) - near the point where investors must decide if they're buying what Whitman is selling." So wrote Investor Place on October 11, 2013.
Position: Buy
Koos van der Merwe
Has been a technical analyst since 1969, and has worked as a futures and options trader with First Financial Futures in Johannesburg, South Africa.
PRINT THIS ARTICLE
ELLIOTT WAVE
Hewlett-Packard Company
10/18/13 12:40:19 PMby Koos van der Merwe
"We're a year and change into Meg Whitman's reign atop Hewlett-Packard (HPQ) - near the point where investors must decide if they're buying what Whitman is selling." So wrote Investor Place on October 11, 2013.
Position: Buy
| HPQ was at the top of the heap, with shares trading at $68.21 in July 2000. Then everything hit the fan, and the share price fell, and fell, and fell. We all know how excellent the products they produce are, so what went wrong? Was it management or was it that the share price was simply following the market trend? If the latter, why did the company appoint Meg Whitman? She has an excellent reputation, and after starting with one foot in the grave, she is slowly turning the company around. Her relentless cost cutting and focus on the balance sheet is paying off in smaller expense lines. HPQ already has laid off around 28,000 of a planned 29,000 from the work force, and apparently the results are meeting with Hewlett-Packard's approval. Her competition? The continued shift to mobile devices offered by Apple, Google, Samsung and others. Will she succeed in reviving the company? What do the charts say? |

|
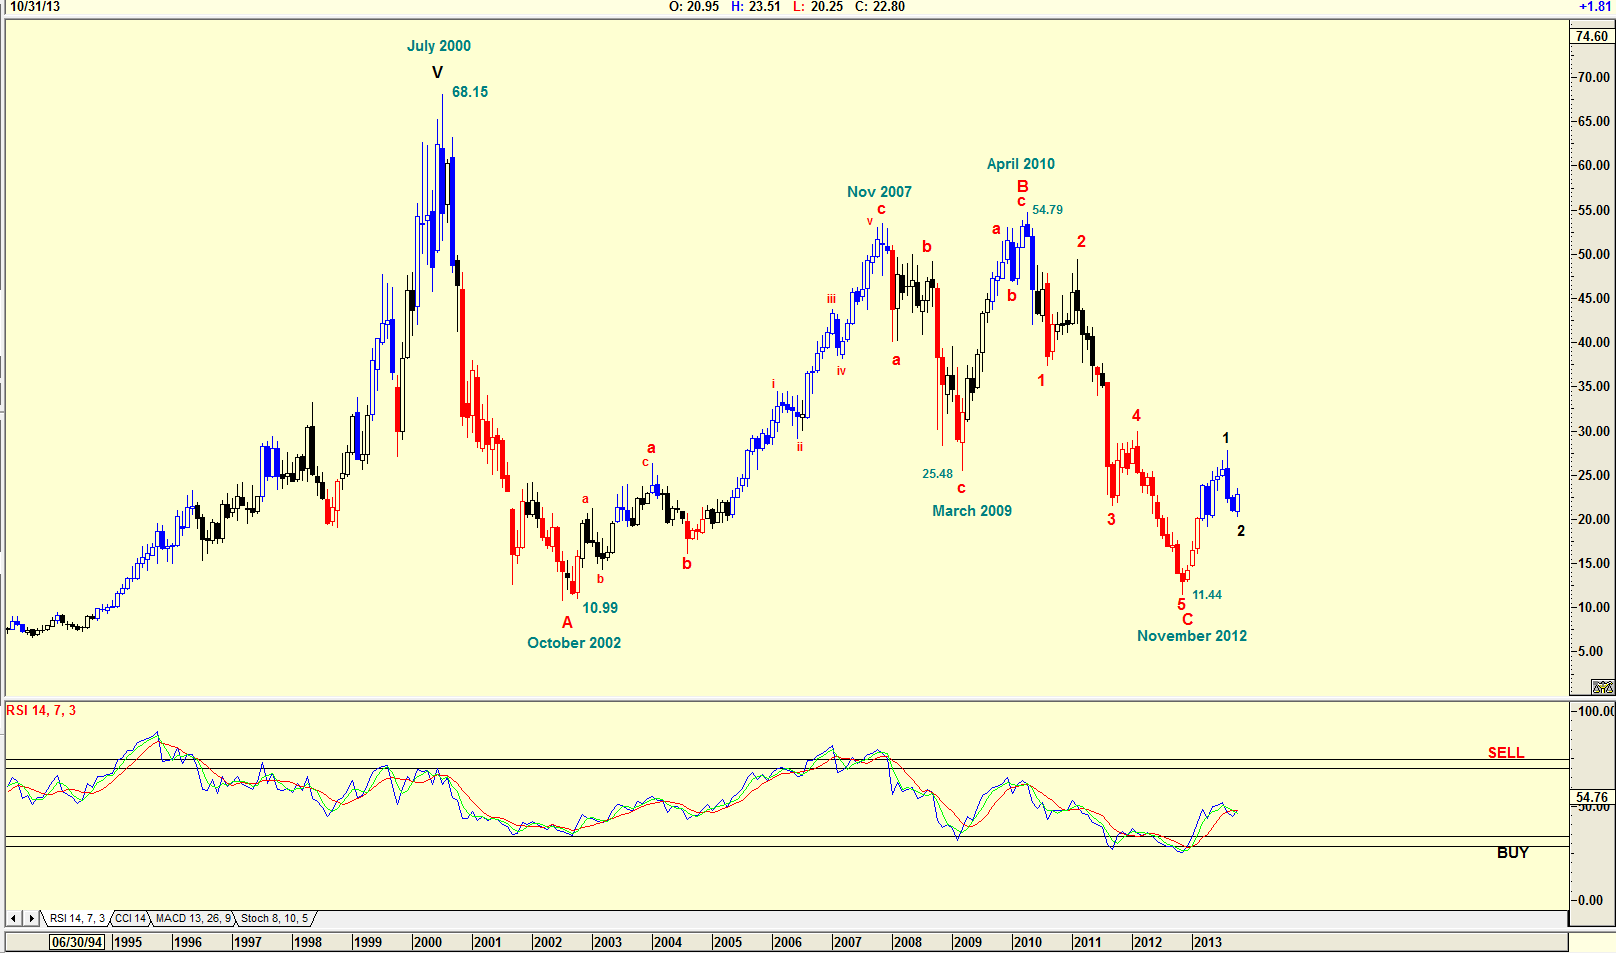
| Figure 1. Monthly chart for HPQ. |
| Graphic provided by: AdvancedGET. |
| |
| The monthly chart in Figure 1 shows an Elliott Wave count that suggests the share price is tracing a wave 2 after completing a major ABC selloff, The chart shows that the share price fell in line with the technology bubble burst of 2000 from a high of $68.15 to a low of $10.99 by October 2002. The share price then recovered in line with the recovery of the market into November 2007, but whereas the major indexes fell on the mortgage-backed security burst bubble into March 2009 before starting to recover in the present BULL trend, HPQ share price only fell to a low of $25.48 by March 2009, nowhere near its low of $10.99 of October 2002. The share price then rose quickly to a high of $54.79 by April 2010, but then started falling, reaching a low of $11.44 by November 2012. What caused the collapse of HPQ from April 2010, a collapse that was unexpected, especially seeing that the share price did not fall below the level of WAVE A? What happened in the world that caused HPQ to bottom in a C-WAVE in November 2012 three years later than the market in general? I can only assume it was because of the introduction of the iPad. People are moving away from desktop and laptop computers. It is far easier to have a tablet computer with 1000+ apps, that can easily fit in a handbag and do exactly what you want. The need for a personal computer as produced by HPQ died. |

|
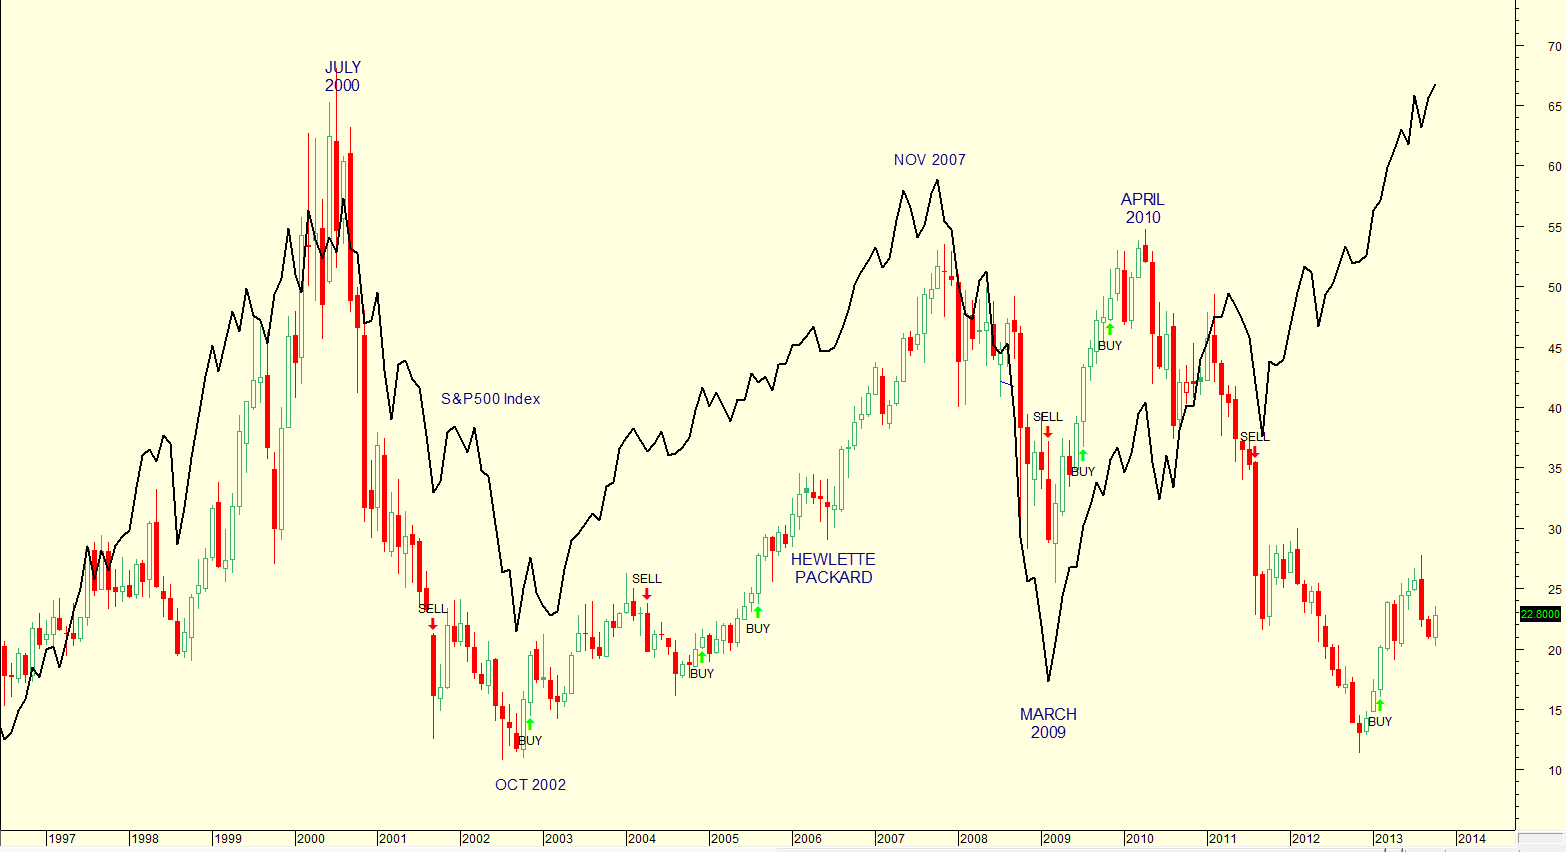
| Figure 2. Comparing HPQ to the S&P 500 index. |
| Graphic provided by: MetaStock. |
| |
| The chart in Figure 2 is a chart of HPQ with the S&P500 index overlaid. You can see how the S&P500 index continued rising after a small correction in April 2010 while HPQ continued to fall. |

|
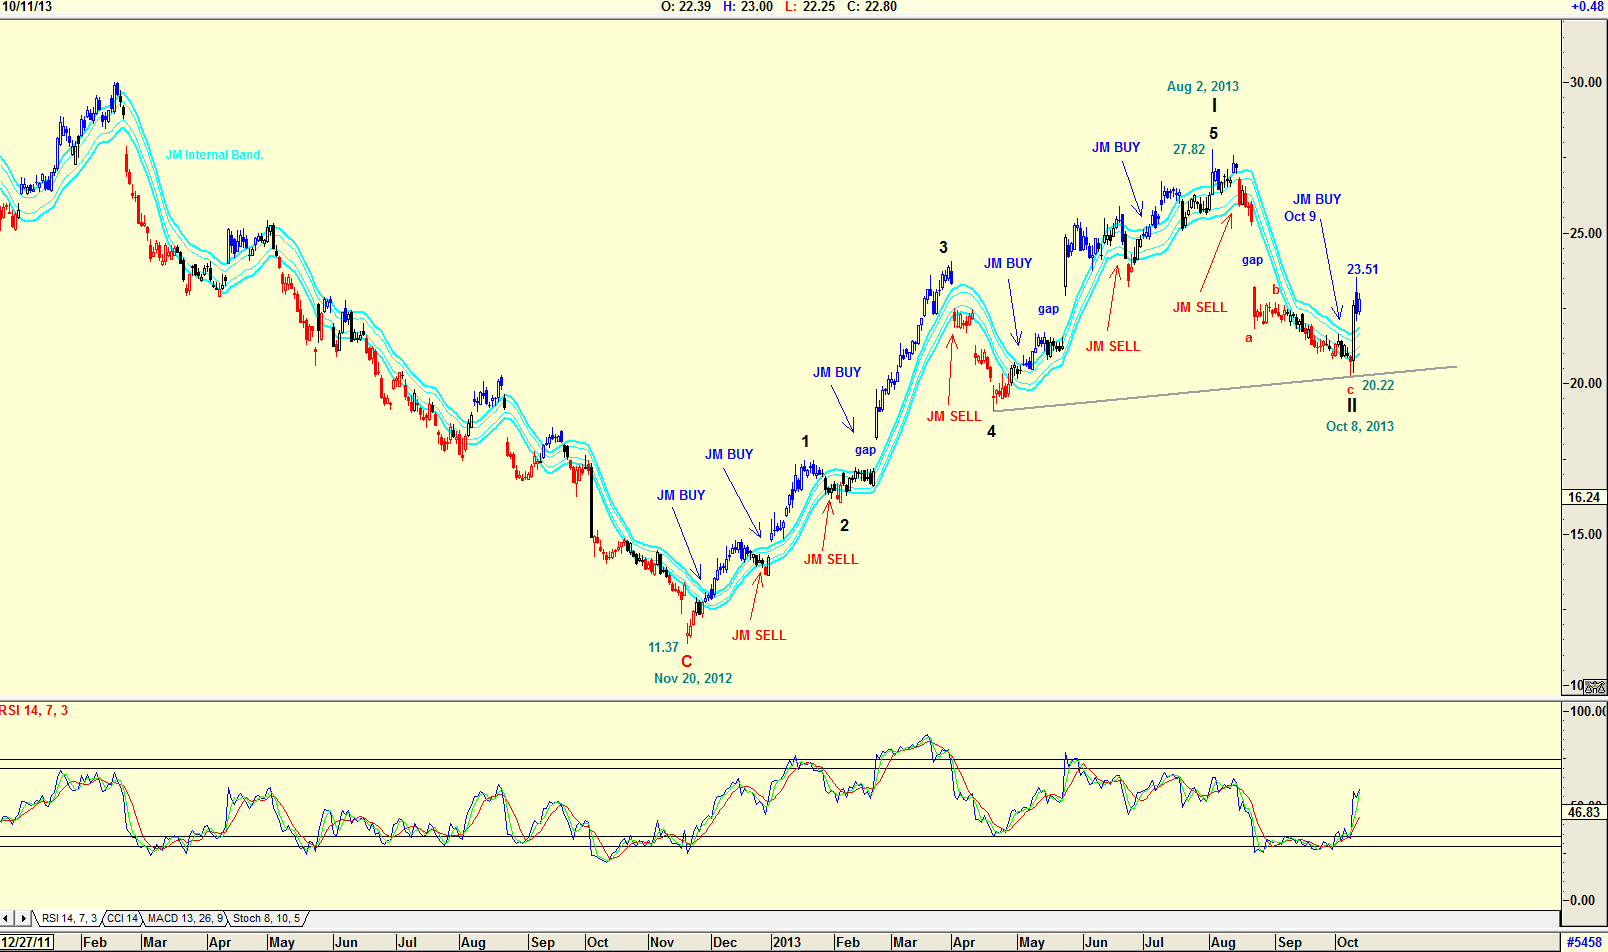
| Figure 3. Daily chart suggesting a buy. |
| Graphic provided by: AdvancedGET. |
| |
| The daily chart in Figure 3 shows how the share price recovered from a low of $11.37 in November 2012, and rose in five waves to a high of $27.82 by August 2, 2013. With the rule, a price should fall to fill a gap, the share price then fell in a WAVE II to $20.22 by October 8, 2013 on a second gap. The price should rise to fill that gap, and it appears that its rise to $23.51 has achieved that. Do note the JM Internal Band buy signal that has been given. A JM Internal band is a 15-period simple moving average offset by 2% and 2% negative. A move above the upper band signals a buy and a move below the lower band a sell. A buy signal in HPQ has been indicated by the RSI indicator and JM Internal Band indicator. I would be a buyer on any correction. Meg Whitman, you are succeeding, slowly but surely. |
Has been a technical analyst since 1969, and has worked as a futures and options trader with First Financial Futures in Johannesburg, South Africa.
| Address: | 3256 West 24th Ave |
| Vancouver, BC | |
| Phone # for sales: | 6042634214 |
| E-mail address: | petroosp@gmail.com |
Click here for more information about our publications!
Comments

Request Information From Our Sponsors
- StockCharts.com, Inc.
- Candle Patterns
- Candlestick Charting Explained
- Intermarket Technical Analysis
- John Murphy on Chart Analysis
- John Murphy's Chart Pattern Recognition
- John Murphy's Market Message
- MurphyExplainsMarketAnalysis-Intermarket Analysis
- MurphyExplainsMarketAnalysis-Visual Analysis
- StockCharts.com
- Technical Analysis of the Financial Markets
- The Visual Investor
- VectorVest, Inc.
- Executive Premier Workshop
- One-Day Options Course
- OptionsPro
- Retirement Income Workshop
- Sure-Fire Trading Systems (VectorVest, Inc.)
- Trading as a Business Workshop
- VectorVest 7 EOD
- VectorVest 7 RealTime/IntraDay
- VectorVest AutoTester
- VectorVest Educational Services
- VectorVest OnLine
- VectorVest Options Analyzer
- VectorVest ProGraphics v6.0
- VectorVest ProTrader 7
- VectorVest RealTime Derby Tool
- VectorVest Simulator
- VectorVest Variator
- VectorVest Watchdog
