HOT TOPICS LIST
- MACD
- Fibonacci
- RSI
- Gann
- ADXR
- Stochastics
- Volume
- Triangles
- Futures
- Cycles
- Volatility
- ZIGZAG
- MESA
- Retracement
- Aroon
INDICATORS LIST
LIST OF TOPICS
PRINT THIS ARTICLE
by Koos van der Merwe
Is the Volatility Index a market leader or is it a follower?
Position: Buy
Koos van der Merwe
Has been a technical analyst since 1969, and has worked as a futures and options trader with First Financial Futures in Johannesburg, South Africa.
PRINT THIS ARTICLE
VOLATILITY
The Volatility Index
10/16/13 04:21:54 PMby Koos van der Merwe
Is the Volatility Index a market leader or is it a follower?
Position: Buy
| On CNBC, Bob Pisani always refers to the Volatility Index as to market direction. The question the listeners ask is, is the VIX a leading indicator or is it a follower? The charts here will help you decide. |

|
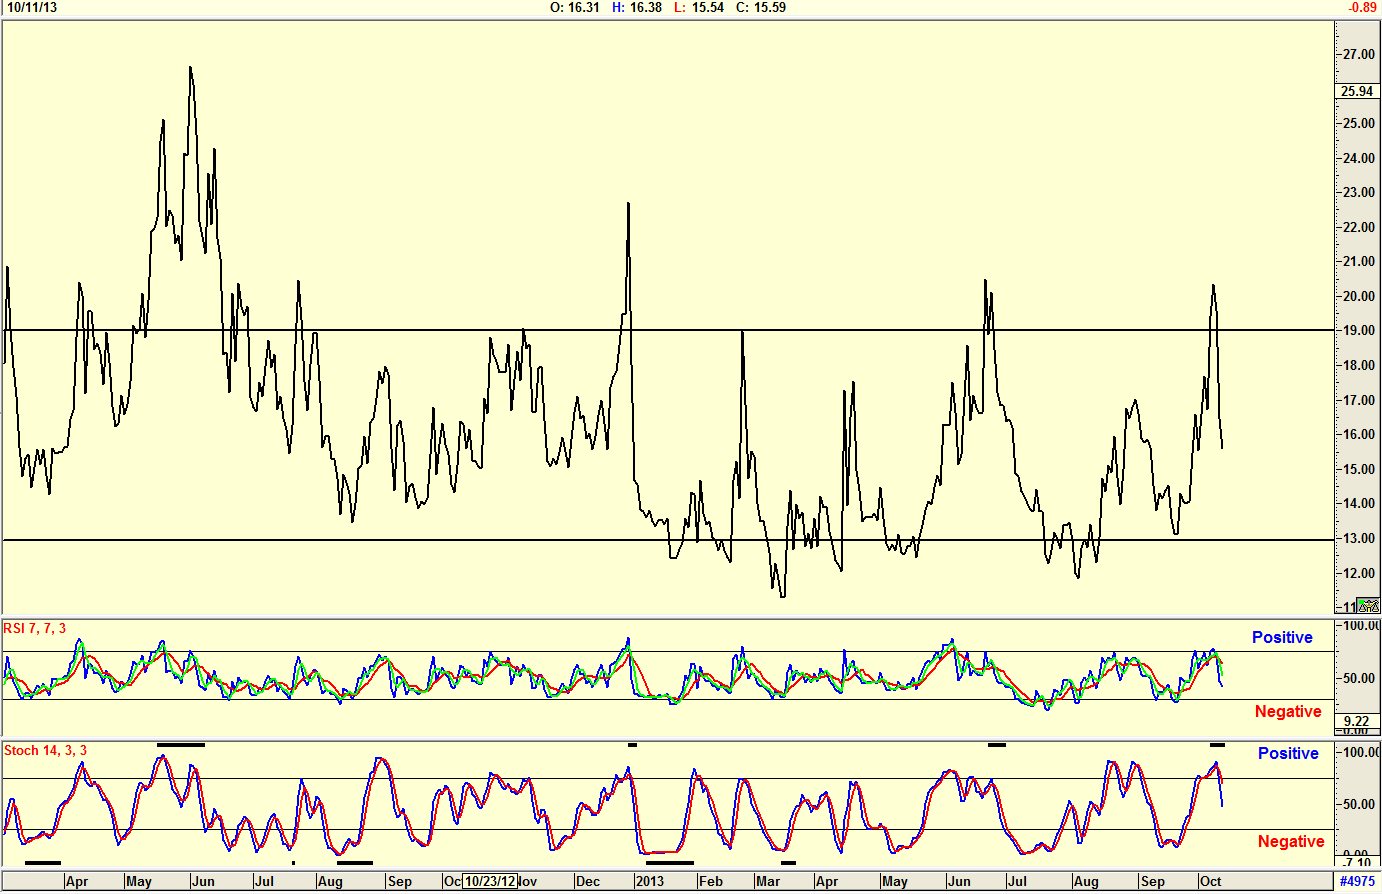
| Figure 1. The VIX Index. |
| Graphic provided by: AdvancedGET. |
| |
| The chart is Figure 1 of the VIX (CBOE Volatility Index) with two indicators, a seven-period RSI and a 14,3,3 stochastic indicator. The horizontal lines on the VIX indicator have been arbitrarily drawn at the 19 level and the 13 level. When the VIX moves above the 19 level it is suggesting the S&P index will start moving into a bull trend. The RSI and stochastic indicators confirm this move. Note that the chart is opposite to what you are used to; in other words, when the RSI is above the 72 level, and stochastic is above the 80 level, this is a positive signal, suggesting that the S&P index will start strengthening. How accurate is the forecast by the VIX? The chart in Figure 2 shows the S&P500 index and the VIX, but I have inverted the VIX on the chart so that it can be better compared. |

|
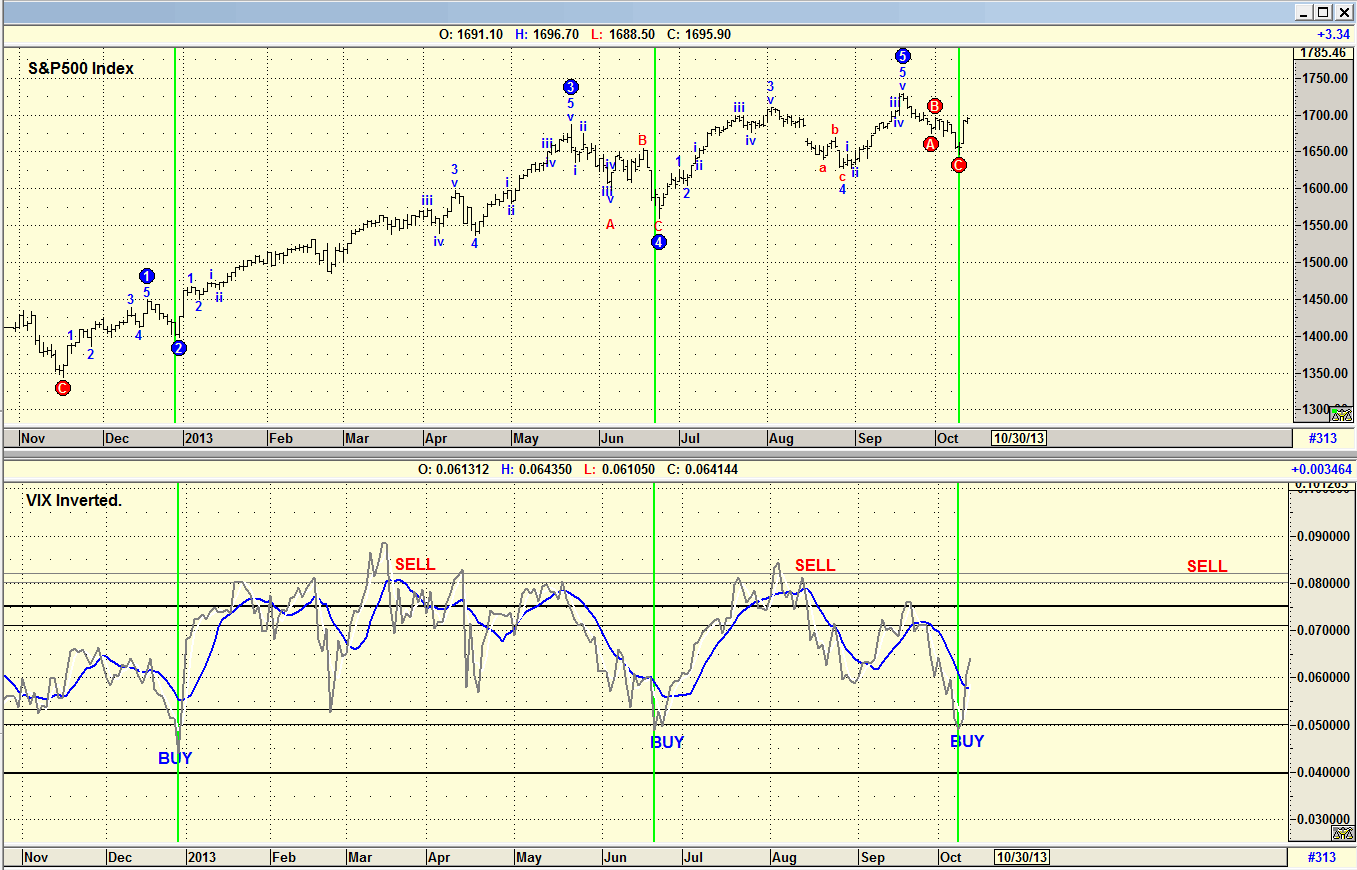
| Figure 2 The S&P500 Index with an inverted VIX. |
| Graphic provided by: AdvancedGET. |
| |
| Note how accurate the VIX has been in suggesting the start of a bull trend, but not that accurate in suggesting a bear trend, often suggesting a sell signal before the S&P 500 index starts trending down. So yes, in a way the VIX can be considered a market leader on the sell side, but in too many instances far too early. On the buy side, that is, forecasting a new bull trend, the VIX has been accurate, but it has not been a leading indicator, unless you look at the movement below the arbitrarily drawn horizontal line and concluded that because the VIX (inverted) has fallen so dramatically, a bull trend of the S&P 500 index is in the wings. |
Has been a technical analyst since 1969, and has worked as a futures and options trader with First Financial Futures in Johannesburg, South Africa.
| Address: | 3256 West 24th Ave |
| Vancouver, BC | |
| Phone # for sales: | 6042634214 |
| E-mail address: | petroosp@gmail.com |
Click here for more information about our publications!
PRINT THIS ARTICLE

Request Information From Our Sponsors
- StockCharts.com, Inc.
- Candle Patterns
- Candlestick Charting Explained
- Intermarket Technical Analysis
- John Murphy on Chart Analysis
- John Murphy's Chart Pattern Recognition
- John Murphy's Market Message
- MurphyExplainsMarketAnalysis-Intermarket Analysis
- MurphyExplainsMarketAnalysis-Visual Analysis
- StockCharts.com
- Technical Analysis of the Financial Markets
- The Visual Investor
- VectorVest, Inc.
- Executive Premier Workshop
- One-Day Options Course
- OptionsPro
- Retirement Income Workshop
- Sure-Fire Trading Systems (VectorVest, Inc.)
- Trading as a Business Workshop
- VectorVest 7 EOD
- VectorVest 7 RealTime/IntraDay
- VectorVest AutoTester
- VectorVest Educational Services
- VectorVest OnLine
- VectorVest Options Analyzer
- VectorVest ProGraphics v6.0
- VectorVest ProTrader 7
- VectorVest RealTime Derby Tool
- VectorVest Simulator
- VectorVest Variator
- VectorVest Watchdog
