

HOT TOPICS LIST
- MACD
- Fibonacci
- RSI
- Gann
- ADXR
- Stochastics
- Volume
- Triangles
- Futures
- Cycles
- Volatility
- ZIGZAG
- MESA
- Retracement
- Aroon
INDICATORS LIST
LIST OF TOPICS
PRINT THIS ARTICLE
by Billy Williams
The market is holding firm but McKesson just signalled a huge sell signal.
Position: Sell
Billy Williams
Billy Williams has been trading the markets for 27 years, specializing in momentum trading with stocks and options.
PRINT THIS ARTICLE
STOCKS
MCK Screaming Sell
10/15/13 02:42:04 PMby Billy Williams
The market is holding firm but McKesson just signalled a huge sell signal.
Position: Sell
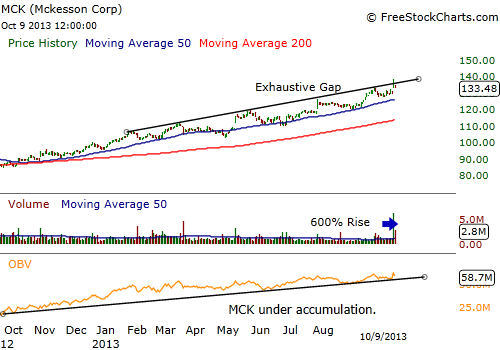
| McKesson Corporation broke above its upper trendline, which at first glance seems to suggest a breakout move to the upside, but a closer look under the hood shows a stock that is screaming "sell". McKesson Corporation (MCK) and its subsidiaries delivers pharmaceuticals, medical supplies, and health care information technologies to the healthcare industry primarily in the United States, but also has operations in North America, the United Kingdom, Ireland, and other European countries, and Israel. The company suffered a significant decline after being caught up in the broad market sell-off from 2008, but the stock has staged a comeback since then and shown strong compelling technical criteria for traders. Specifically, the stock has "stair-stepped" its way back from the decline and morphed into a strong bullish trend. |
|
| Figure 1. MCK has been under steady accumulation according to rising volume which has helped it stay locked in a firm uptrend, but a huge spike of 600% over the 50-day average volume level signals a potential trend reversal. |
| Graphic provided by: www.freestockcharts.com. |
| |
| Price charts show a stock that has made consistent higher highs and higher lows in its price action and only stopped advancing during slight consolidation phases. During these consolidation phases price reverted back to its mean, or entered a period of price contraction where it built up a new base pattern before continuing its advance. This is apparent from the end of 2012 to where it currently trades when price began to undergo accumulation. This was indicated by the on balance volume (OBV) indicator. The OBV shows that the stock was steadily being accumulated by both retail and institutional traders. The rise in volume can also be attributed by MCK buying back over a billion shares of its own stock in each of the last three years, reducing its supply and experiencing an increase in share value as demand moved in step with the stock's advance. Also, notice that the 50-day and 200-day SMAs are in perfect harmony with each other as the 50-day SMA traded over the 200-day SMA since November 2012 up till now. This is characteristic of a strong stock that is firmly under control of the bulls. |
|
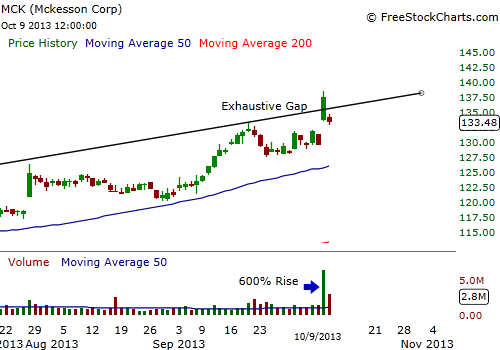
| Figure 2. The gap up in price coupled with a 600% increase of volume over the 50-day volume average could be an exhaustive move that signals the end of the bull run. Stock holders should sell or at least tighten their stops if the trend fails to resume its direction. |
| Graphic provided by: www.freestockcharts.com. |
| |
| Entries were easily available as MCK made low-volume pullbacks to the 50-day SMA and provided traders the opportunity to enter MCK's trend and added new positions at each pullback point. But, last week's price action on October 8, 2013 screams "sell" to traders. Volume swelled to over 600% of its 50-day average as the stock gapped higher and broke through its upper trendline. This combination of factors — upper trendline break and volume spike — indicates an exhaustive gap where MCK's trend is likely to reverse. |
| Will the stock crater? Hard to say, but it could just enter a correction or close its gap and consolidate for an indefinite amount of time. However, price and volume reveal that the bull run is over and it's time to step aside. Exit any positions you have and sit tight for another opportunity but keep MCK on your watchlist because the stock could recover and enter another Stage 2 trend. |
Billy Williams has been trading the markets for 27 years, specializing in momentum trading with stocks and options.
| Company: | StockOptionSystem.com |
| E-mail address: | stockoptionsystem.com@gmail.com |
Traders' Resource Links | |
| StockOptionSystem.com has not added any product or service information to TRADERS' RESOURCE. | |
Click here for more information about our publications!
PRINT THIS ARTICLE

Request Information From Our Sponsors
- VectorVest, Inc.
- Executive Premier Workshop
- One-Day Options Course
- OptionsPro
- Retirement Income Workshop
- Sure-Fire Trading Systems (VectorVest, Inc.)
- Trading as a Business Workshop
- VectorVest 7 EOD
- VectorVest 7 RealTime/IntraDay
- VectorVest AutoTester
- VectorVest Educational Services
- VectorVest OnLine
- VectorVest Options Analyzer
- VectorVest ProGraphics v6.0
- VectorVest ProTrader 7
- VectorVest RealTime Derby Tool
- VectorVest Simulator
- VectorVest Variator
- VectorVest Watchdog
- StockCharts.com, Inc.
- Candle Patterns
- Candlestick Charting Explained
- Intermarket Technical Analysis
- John Murphy on Chart Analysis
- John Murphy's Chart Pattern Recognition
- John Murphy's Market Message
- MurphyExplainsMarketAnalysis-Intermarket Analysis
- MurphyExplainsMarketAnalysis-Visual Analysis
- StockCharts.com
- Technical Analysis of the Financial Markets
- The Visual Investor