HOT TOPICS LIST
- MACD
- Fibonacci
- RSI
- Gann
- ADXR
- Stochastics
- Volume
- Triangles
- Futures
- Cycles
- Volatility
- ZIGZAG
- MESA
- Retracement
- Aroon
INDICATORS LIST
LIST OF TOPICS
PRINT THIS ARTICLE
by Gary Grosschadl
Amazon.com has had a good run off its lows and the ascending triangle is potentially a bullish formation BUT ...
Position: N/A
Gary Grosschadl
Independent Canadian equities trader and technical analyst based in Peterborough
Ontario, Canada.
PRINT THIS ARTICLE
CHART ANALYSIS
Amazon.com's Weekly Chart Says It's Still A Jungle Out There
09/25/02 03:24:20 PMby Gary Grosschadl
Amazon.com has had a good run off its lows and the ascending triangle is potentially a bullish formation BUT ...
Position: N/A
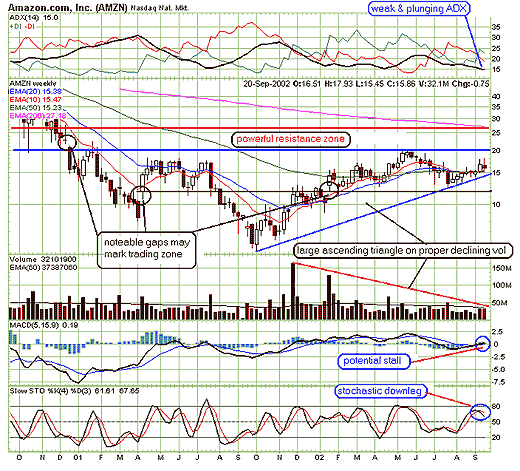
| Amazon.com's weekly chart has bullish implications if you're looking at the ascending triangle. But there are mitigating factors making it a jungle for traders going forward. To break above the triangle requires major volume to overcome that resistance zone marked by not only the 200-day EMA overhead resistance but also a previous gap area around $22. |
| A more likely scenario is a trading zone for AMZN for the following reasons : 1. Weak and plunging ADX suggests little trend strength going forward 2. Short-term stochastics show a potential downleg starting 3. Previous gap support likely strong between $12-13 4. Chance of MACD stall at zero line 5. Powerful overhead resistance zone with gap resistance |

|
| Graphic provided by: stockcharts.com. |
| |
| If this trading zone is correct, traders will be able to profit by waiting for stochastic reversals near those channel lines (i.e. $12-13 to $19-20). A break above or below this channel could be noteworthy, suggesting bigger changes, either a bullish upthrust or a bearish downleg. In the meantime alert traders can use short term stochastic turns as a short term guideline while monitoring their other favorite indicators. |
Independent Canadian equities trader and technical analyst based in Peterborough
Ontario, Canada.
| Website: | www.whatsonsale.ca/financial.html |
| E-mail address: | gwg7@sympatico.ca |
Click here for more information about our publications!
PRINT THIS ARTICLE

Request Information From Our Sponsors
- StockCharts.com, Inc.
- Candle Patterns
- Candlestick Charting Explained
- Intermarket Technical Analysis
- John Murphy on Chart Analysis
- John Murphy's Chart Pattern Recognition
- John Murphy's Market Message
- MurphyExplainsMarketAnalysis-Intermarket Analysis
- MurphyExplainsMarketAnalysis-Visual Analysis
- StockCharts.com
- Technical Analysis of the Financial Markets
- The Visual Investor
- VectorVest, Inc.
- Executive Premier Workshop
- One-Day Options Course
- OptionsPro
- Retirement Income Workshop
- Sure-Fire Trading Systems (VectorVest, Inc.)
- Trading as a Business Workshop
- VectorVest 7 EOD
- VectorVest 7 RealTime/IntraDay
- VectorVest AutoTester
- VectorVest Educational Services
- VectorVest OnLine
- VectorVest Options Analyzer
- VectorVest ProGraphics v6.0
- VectorVest ProTrader 7
- VectorVest RealTime Derby Tool
- VectorVest Simulator
- VectorVest Variator
- VectorVest Watchdog
