HOT TOPICS LIST
- MACD
- Fibonacci
- RSI
- Gann
- ADXR
- Stochastics
- Volume
- Triangles
- Futures
- Cycles
- Volatility
- ZIGZAG
- MESA
- Retracement
- Aroon
INDICATORS LIST
LIST OF TOPICS
PRINT THIS ARTICLE
by Billy Williams
The market looked ready to dive but a closer look shows that it may be just shaking out nervous investors.
Position: Buy
Billy Williams
Billy Williams has been trading the markets for 27 years, specializing in momentum trading with stocks and options.
PRINT THIS ARTICLE
VOLATILITY
Shaking Out Nervous Investors
10/10/13 05:09:39 PMby Billy Williams
The market looked ready to dive but a closer look shows that it may be just shaking out nervous investors.
Position: Buy
| The market took a strong step in the bear's direction when daily price action closed down more than 1% on major indexes on higher volume. But does this downward price movement have any real momentum or is it just to shake out the smaller traders? The consensus on both Wall Street and the global markets is that the US will raise its debt limit and avoid defaulting on its obligations, but that doesn't mean that the "smart money" won't rattle investors into selling. If you study the CBOE Market Volatility Index, or VIX, you can gain a glimpse into the emotional state of most traders. The index is an inverse measurement of investor sentiment and measures the buying and selling of OEX options and is affectionately referred to as the "fear index" because it creates a visual reference of how many traders are selling and/or covering with OEX put options. In addition, it also measures how many OEX call options are being purchased to measure the level of greed in the market. Why would this information be valuable to you? |

|
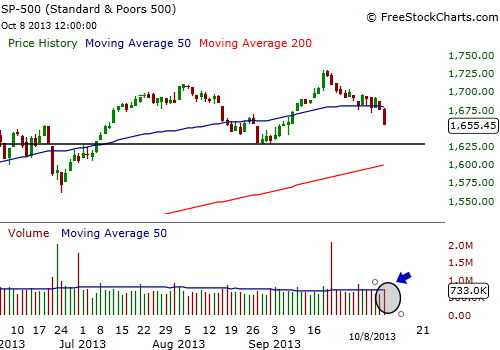
| Figure 1. The price action of the last bar revealed a bearish price bar that closed with a lot of downside force but did it on low trade volume. This would suggest that the bearish price movement doesn't have as much momentum as it first appeared. |
| Graphic provided by: www.freestockcharts.com. |
| |
| Behavioral finance shows that investors typically make the wrong decisions about their money at the wrong time due to uncontrolled emotions. This hampers their ability to make intelligent decisions about their money and is why crowds are often wrong in the market. By studying the VIX, you can see what the crowds are doing at extreme levels of price action in the stock market and use that as an indicator to do the opposite and win. By overlapping Bollinger Bands on top of the VIX, you can better see where extreme levels of price action are taking place and time your entries with better precision. Bollinger Bands measure the volatility of the underlying security and show where price is expanding and likely to revert back to the mean. |

|
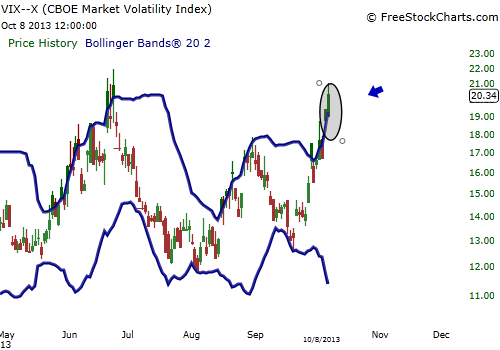
| Figure 2. The VIX closed above its upper Bollinger Band and is ready to revert back to its mean. This snapback would indicate a long signal in the SPX which could resume its upward price trend. |
| Graphic provided by: www.freestockcharts.com. |
| |
| To time long entries, when the VIX exceeds the upper Bollinger Band it indicates bearish price action in the SPX and that a short-term bottom is forming and reveals a setup for the SPX to snapback in the direction of the bulls. In this current market, the VIX has exceeded its upper Bollinger Band (Figure 2) which reveals that the market may reverse and resume its bullish trend. These extreme levels often can't be sustained in the short-term and will reverse like a rubberband that has been stretched too far, released, and snapped back to its mean. If you combine that with the low volume, you may come to doubt that price action has any legs on it and that any further bearish price action may not come about. It may just be an attempt to shakeout the nervous investors by the "smart money" or those who are trying to gain a better foothold in the market at everyone else's expense. |
| To time your long entry, you need to wait for the VIX to close below Tuesday's intraday low and then either go long on the SPX by purchasing call options or implement a bull put spread if you want to limit your risk even more. |
Billy Williams has been trading the markets for 27 years, specializing in momentum trading with stocks and options.
| Company: | StockOptionSystem.com |
| E-mail address: | stockoptionsystem.com@gmail.com |
Traders' Resource Links | |
| StockOptionSystem.com has not added any product or service information to TRADERS' RESOURCE. | |
Click here for more information about our publications!
Comments
Date: 10/14/13Rank: 3Comment:
Date: 10/14/13Rank: 4Comment:

Request Information From Our Sponsors
- VectorVest, Inc.
- Executive Premier Workshop
- One-Day Options Course
- OptionsPro
- Retirement Income Workshop
- Sure-Fire Trading Systems (VectorVest, Inc.)
- Trading as a Business Workshop
- VectorVest 7 EOD
- VectorVest 7 RealTime/IntraDay
- VectorVest AutoTester
- VectorVest Educational Services
- VectorVest OnLine
- VectorVest Options Analyzer
- VectorVest ProGraphics v6.0
- VectorVest ProTrader 7
- VectorVest RealTime Derby Tool
- VectorVest Simulator
- VectorVest Variator
- VectorVest Watchdog
- StockCharts.com, Inc.
- Candle Patterns
- Candlestick Charting Explained
- Intermarket Technical Analysis
- John Murphy on Chart Analysis
- John Murphy's Chart Pattern Recognition
- John Murphy's Market Message
- MurphyExplainsMarketAnalysis-Intermarket Analysis
- MurphyExplainsMarketAnalysis-Visual Analysis
- StockCharts.com
- Technical Analysis of the Financial Markets
- The Visual Investor
