HOT TOPICS LIST
- MACD
- Fibonacci
- RSI
- Gann
- ADXR
- Stochastics
- Volume
- Triangles
- Futures
- Cycles
- Volatility
- ZIGZAG
- MESA
- Retracement
- Aroon
INDICATORS LIST
LIST OF TOPICS
PRINT THIS ARTICLE
by Koos van der Merwe
So said President Obama in his speech on Tuesday, September 8 as the S&P500 fell 1%.
Position: Accumulate
Koos van der Merwe
Has been a technical analyst since 1969, and has worked as a futures and options trader with First Financial Futures in Johannesburg, South Africa.
PRINT THIS ARTICLE
ELLIOTT WAVE
Insane, Catastrophic, Chaotic
10/09/13 04:31:19 PMby Koos van der Merwe
So said President Obama in his speech on Tuesday, September 8 as the S&P500 fell 1%.
Position: Accumulate
| The Government shut down and the confrontation between Congress and the White House is seriously affecting the stock market. Does that mean this is a buying opportunity or will the market fall further? |

|
| Figure 1. Weekly Elliott wave count of the S&P500 Index. |
| Graphic provided by: AdvancedGET. |
| |
| The weekly chart in Figure 1 of the S&P500 index shows my revised Elliott wave count. You should never forget that the Elliott wave theory is simply a signpost in the wilderness, and that sign can change a little way down the road. The Elliott wave count on the chart does look correct, obeying the first rule of Elliott wave theory. What is a concern however, is that the chart also suggests that the index could fall further, possibly to test the support line in the region of 1514 level — not a good sign for the market. The RSI indicator trending downwards is confirming this correction. Wave 2 of WAVE III was a simple correction, which means that Wave 4 of WAVE III should be a complicated wave. So far the abc correction in Wave 4 of WAVE III is complicated as the President and Congress spar with each other, but should you start buying shares now, or should you wait for the dust to settle? |

|
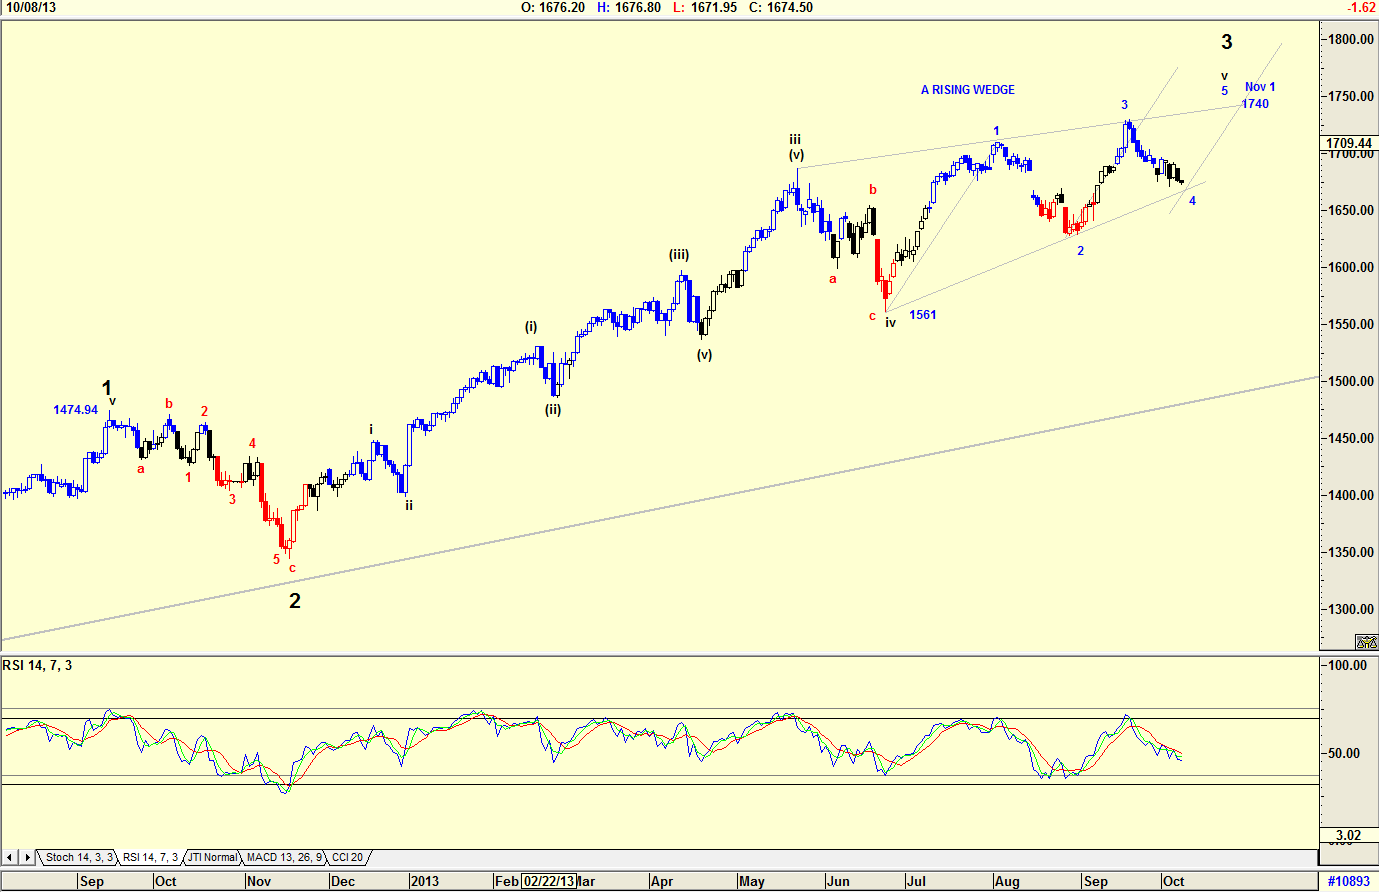
| Figure 2. Daily Elliott wave count of the S&P500 Index showing what could be a rising wedge. |
| Graphic provided by: AdvancedGET. |
| |
| Looking at the daily chart in Figure 2 what should catch your attention is the rising wedge that appears to be forming. The rising wedge shown could develop into a rising pennant, a pattern commonly found in a wave 5 caused by uncertainty in the market as both the bulls and bears pull against each other. If this is the trend, then the index should start rising into the 1740 region completing a wave v of Wave 3, also completing the Wave 3. Following the trend angles, this could be reached by November 1, 2013 allowing four days either side as a margin of error. Of course, the problem then arises in the Wave 4 correction once Wave 3 is complete. How far can Wave 4 correct? We know that Elliott wave rules say that a Wave 4 should not fall below the level of Wave 1. Well, Wave 1 topped out at 1474.94, so we know that a wave 4 correction cannot fall below that level. We also know that if Wave 2 is simple then Wave 4 will be complicated and vice versa. Looking at Wave 2, we are not certain whether this is a complicated or simple wave, which means that Wave 4 could be extremely simple, or extremely complicated. Personally, I believe that because November to March are usually the best months of the year for the market, Wave 4 could be simple, but, there are always exceptions, something you should never forget. The antagonism and confrontation between President Obama and Congress is seriously affecting the market. However, the US economy and the welfare of its citizens must take preference over political hostility. Yes, the market will strengthen, but it will not be smooth and easy. |
Has been a technical analyst since 1969, and has worked as a futures and options trader with First Financial Futures in Johannesburg, South Africa.
| Address: | 3256 West 24th Ave |
| Vancouver, BC | |
| Phone # for sales: | 6042634214 |
| E-mail address: | petroosp@gmail.com |
Click here for more information about our publications!
PRINT THIS ARTICLE

Request Information From Our Sponsors
- StockCharts.com, Inc.
- Candle Patterns
- Candlestick Charting Explained
- Intermarket Technical Analysis
- John Murphy on Chart Analysis
- John Murphy's Chart Pattern Recognition
- John Murphy's Market Message
- MurphyExplainsMarketAnalysis-Intermarket Analysis
- MurphyExplainsMarketAnalysis-Visual Analysis
- StockCharts.com
- Technical Analysis of the Financial Markets
- The Visual Investor
- VectorVest, Inc.
- Executive Premier Workshop
- One-Day Options Course
- OptionsPro
- Retirement Income Workshop
- Sure-Fire Trading Systems (VectorVest, Inc.)
- Trading as a Business Workshop
- VectorVest 7 EOD
- VectorVest 7 RealTime/IntraDay
- VectorVest AutoTester
- VectorVest Educational Services
- VectorVest OnLine
- VectorVest Options Analyzer
- VectorVest ProGraphics v6.0
- VectorVest ProTrader 7
- VectorVest RealTime Derby Tool
- VectorVest Simulator
- VectorVest Variator
- VectorVest Watchdog
