

HOT TOPICS LIST
- MACD
- Fibonacci
- RSI
- Gann
- ADXR
- Stochastics
- Volume
- Triangles
- Futures
- Cycles
- Volatility
- ZIGZAG
- MESA
- Retracement
- Aroon
INDICATORS LIST
LIST OF TOPICS
PRINT THIS ARTICLE
by Donald W. Pendergast, Jr.
No broad-market analysis studies are one hundred percent accurate, but many can still be used to help predict near-term reversals in the S&P 500 index.
Position: N/A
Donald W. Pendergast, Jr.
Freelance financial markets writer and online publisher of the Trendzetterz.com S&P 500 Weekly Forecast service.
PRINT THIS ARTICLE
CORRELATION ANALYSIS
SPY and VXX: Interesting Inverse Correlations
10/09/13 04:22:31 PMby Donald W. Pendergast, Jr.
No broad-market analysis studies are one hundred percent accurate, but many can still be used to help predict near-term reversals in the S&P 500 index.
Position: N/A
| Experienced traders and investors frequently rely on the use of correlation analysis to help them better understand the trading patterns of various financial markets; when interpreted properly, such studies can help them stay prepared for possible reversal or breakout situations in the markets they trade. Here's an interesting look at the inverse correlation relationship between the iPath S&P 500 VIX Short-Term ETF (VXX) and the S&P Depository Receipts ETF (SPY) over the past year, along with some ideas on how to play a potentially bullish reversal in the S&P 500 index. |
|
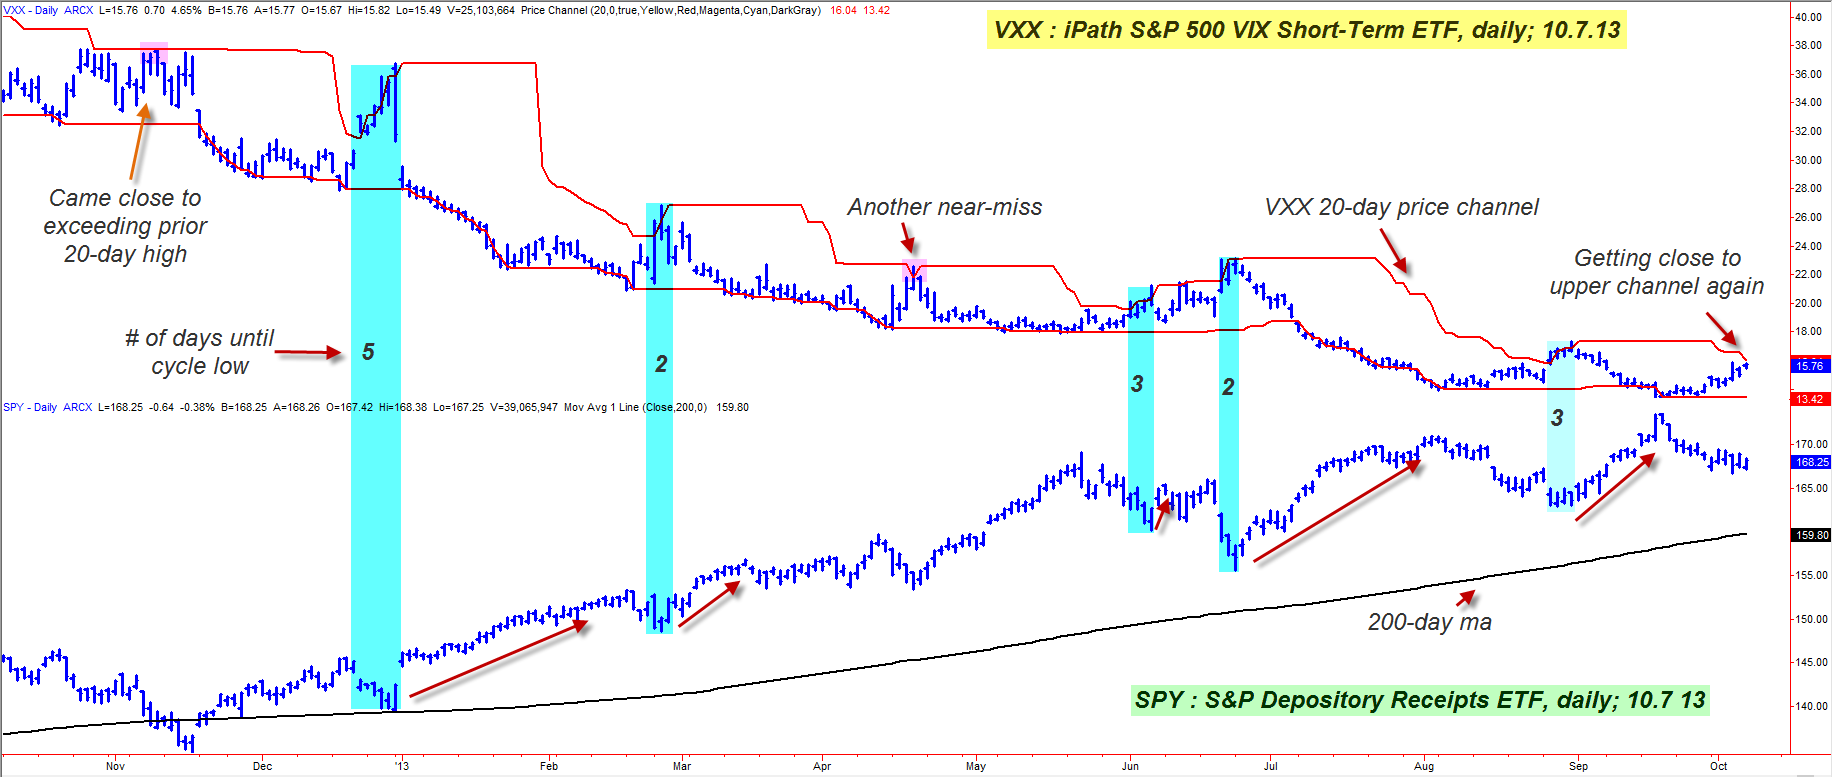
| Figure 1. Over the past year, a potentially profitable set of technical dynamics have done a good job of predicting near-term bullish reversals in the S&P 500 index (.SPX, SPY). |
| Graphic provided by: TradeStation. |
| |
| The daily chart in Figure 1 features VXX in the upper half and SPY in the lower half; a 20-day price channel is overlaid on the VXX price series and a simple 200-day moving average (SMA) is used to track the long-term trend in SPY — the ETF proxy for equity market traders wishing to take long or short positions in the S&P 500 index (.SPX). Now, there is nothing in the way of radical technical analysis research here; in fact, all you need is reasonable clear vision to confirm that whenever VXX rises above its upper 20-day channel line, a bullish reversal will typically manifest in SPY within the next one to five trading sessions — at least according to this most recent 12-month dataset. During that time, the VXX managed to break its most recent 20-day high on six occasions, with the reversal into a cycle low in the SPY occurring this many trading sessions later: 1. Five days 2. Two days 3. Three days 4. Two days 5. Three days Of these five instances, every one of them produced a tradable bullish swing move in SPY, with several of them also initiating longer-term trending moves. In fact, there were also a couple of near "misses" of the VXX 20-day channel high back in early November 2012 and again in mid-April 2013; in the case of the first one, a major cycle low appeared in SPY only five trading sessions later. In the latter "miss" setup, SPY made a major multicycle low the very same day. Of the five cycle lows that were preceded by a VXX above its previous 20-day channel high, all of them were completed with the SPY trading above its upward sloping 200-day moving average, as did the "miss" trade of April 2013. The first "near miss" trade setup of November 2012 ultimately saw the cycle low in SPY occur a little below the 200-day moving average. So here are a few items of note when seeking to time cycle low reversals in the SPY: 1. If VXX breaks above its previous 20-day channel high, or comes close to doing so, assume that SPY may be preparing to make a tradable cycle low within the next five trading sessions. 2. If the SPY is trading above its 200-day moving average, the odds of timing a long entry coming out of a cycle low may be enhanced. 3. If the 200-day moving average in SPY is sloping upward at the time of the VXX 20-day channel high break, the odds of a successful long post-cycle low entry may add even more of a bullish bias. |
|
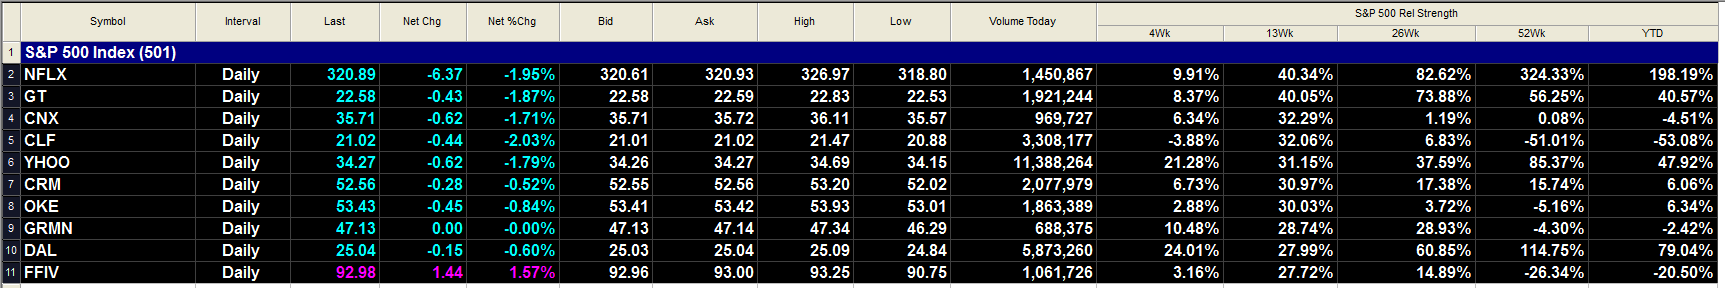
| Figure 2. Should the .SPX bottom and reverse within the next one to two weeks, look to find suitable long re-entry areas on the component stocks with the strongest 13-week relative strength vs. the S&P 500 index. Here are the current top 10 in terms of 13-week RS. |
| Graphic provided by: TradeStation. |
| Graphic provided by: TradeStation Radar Screen. |
| |
| Now, of course, there also seems to be a bias in going long SPY or short VXX when VXX breaks below its most recent 20-day channel low; such an occurrence reflects a lessening in volatility — the kind often seen when SPY enters into a medium- to long-term bullish trending phase. However, you would need to use some kind of a trailing stop (a moving average or even another price channel length) to help you determine the opportune time to exit such trades. There are a near-infinite number of ways that traders can position themselves to capitalize on the expansion and contraction of S&P 500 market volatility; what you've seen here might spark a number of creative ideas of your own as to how to get on — and stay on — the right side of the all-important S&P 500 index and its ETF proxy, SPY. Trade wisely until we meet here again. |
Freelance financial markets writer and online publisher of the Trendzetterz.com S&P 500 Weekly Forecast service.
| Title: | Market consultant and writer |
| Company: | Trendzetterz |
| Address: | 81 Hickory Hollow Drive |
| Crossville, TN 38555 | |
| Phone # for sales: | 904-303-4814 |
| Website: | trendzetterz.com |
| E-mail address: | support@trendzetterz.com |
Traders' Resource Links | |
| Trendzetterz has not added any product or service information to TRADERS' RESOURCE. | |
Click here for more information about our publications!
Comments

Request Information From Our Sponsors
- StockCharts.com, Inc.
- Candle Patterns
- Candlestick Charting Explained
- Intermarket Technical Analysis
- John Murphy on Chart Analysis
- John Murphy's Chart Pattern Recognition
- John Murphy's Market Message
- MurphyExplainsMarketAnalysis-Intermarket Analysis
- MurphyExplainsMarketAnalysis-Visual Analysis
- StockCharts.com
- Technical Analysis of the Financial Markets
- The Visual Investor
- VectorVest, Inc.
- Executive Premier Workshop
- One-Day Options Course
- OptionsPro
- Retirement Income Workshop
- Sure-Fire Trading Systems (VectorVest, Inc.)
- Trading as a Business Workshop
- VectorVest 7 EOD
- VectorVest 7 RealTime/IntraDay
- VectorVest AutoTester
- VectorVest Educational Services
- VectorVest OnLine
- VectorVest Options Analyzer
- VectorVest ProGraphics v6.0
- VectorVest ProTrader 7
- VectorVest RealTime Derby Tool
- VectorVest Simulator
- VectorVest Variator
- VectorVest Watchdog